CL Holdings' (TSE:4286) 61% return outpaced the company's earnings growth over the same one-year period


Passive investing in index funds can generate returns that roughly match the overall market. But if you pick the right individual stocks, you could make more than that. To wit, the CL Holdings Inc. (TSE:4286) share price is 58% higher than it was a year ago, much better than the market return of around 38% (not including dividends) in the same period. So that should have shareholders smiling. In contrast, the longer term returns are negative, since the share price is 26% lower than it was three years ago.
Since the stock has added JP¥2.1b to its market cap in the past week alone, let's see if underlying performance has been driving long-term returns.
See our latest analysis for CL Holdings
To quote Buffett, 'Ships will sail around the world but the Flat Earth Society will flourish. There will continue to be wide discrepancies between price and value in the marketplace...' One imperfect but simple way to consider how the market perception of a company has shifted is to compare the change in the earnings per share (EPS) with the share price movement.
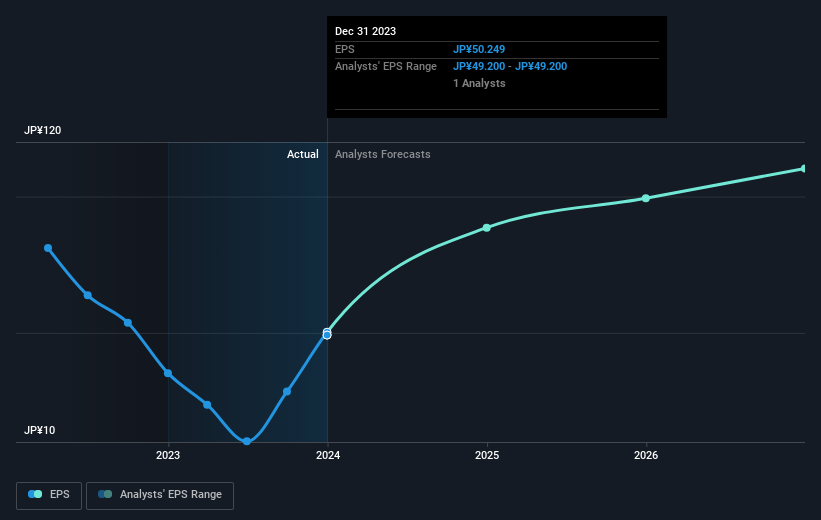
During the last year CL Holdings grew its earnings per share (EPS) by 43%. The share price gain of 58% certainly outpaced the EPS growth. This indicates that the market is now more optimistic about the stock.
You can see below how EPS has changed over time (discover the exact values by clicking on the image).
We know that CL Holdings has improved its bottom line lately, but is it going to grow revenue? Check if analysts think CL Holdings will grow revenue in the future.
What About Dividends?
As well as measuring the share price return, investors should also consider the total shareholder return (TSR). The TSR is a return calculation that accounts for the value of cash dividends (assuming that any dividend received was reinvested) and the calculated value of any discounted capital raisings and spin-offs. So for companies that pay a generous dividend, the TSR is often a lot higher than the share price return. We note that for CL Holdings the TSR over the last 1 year was 61%, which is better than the share price return mentioned above. The dividends paid by the company have thusly boosted the total shareholder return.
A Different Perspective
It's nice to see that CL Holdings shareholders have received a total shareholder return of 61% over the last year. And that does include the dividend. Since the one-year TSR is better than the five-year TSR (the latter coming in at 9% per year), it would seem that the stock's performance has improved in recent times. In the best case scenario, this may hint at some real business momentum, implying that now could be a great time to delve deeper. While it is well worth considering the different impacts that market conditions can have on the share price, there are other factors that are even more important. To that end, you should be aware of the 1 warning sign we've spotted with CL Holdings .
If you would prefer to check out another company -- one with potentially superior financials -- then do not miss this free list of companies that have proven they can grow earnings.
Please note, the market returns quoted in this article reflect the market weighted average returns of stocks that currently trade on Japanese exchanges.
If you're looking to trade CL Holdings, open an account with the lowest-cost platform trusted by professionals, Interactive Brokers.
With clients in over 200 countries and territories, and access to 160 markets, IBKR lets you trade stocks, options, futures, forex, bonds and funds from a single integrated account.
Enjoy no hidden fees, no account minimums, and FX conversion rates as low as 0.03%, far better than what most brokers offer.
Sponsored ContentNew: AI Stock Screener & Alerts
Our new AI Stock Screener scans the market every day to uncover opportunities.
• Dividend Powerhouses (3%+ Yield)
• Undervalued Small Caps with Insider Buying
• High growth Tech and AI Companies
Or build your own from over 50 metrics.
Have feedback on this article? Concerned about the content? Get in touch with us directly. Alternatively, email editorial-team (at) simplywallst.com.
This article by Simply Wall St is general in nature. We provide commentary based on historical data and analyst forecasts only using an unbiased methodology and our articles are not intended to be financial advice. It does not constitute a recommendation to buy or sell any stock, and does not take account of your objectives, or your financial situation. We aim to bring you long-term focused analysis driven by fundamental data. Note that our analysis may not factor in the latest price-sensitive company announcements or qualitative material. Simply Wall St has no position in any stocks mentioned.
About TSE:4286
Adequate balance sheet average dividend payer.
