Some Confidence Is Lacking In DLE Inc. (TSE:3686) As Shares Slide 30%


The DLE Inc. (TSE:3686) share price has fared very poorly over the last month, falling by a substantial 30%. Instead of being rewarded, shareholders who have already held through the last twelve months are now sitting on a 43% share price drop.
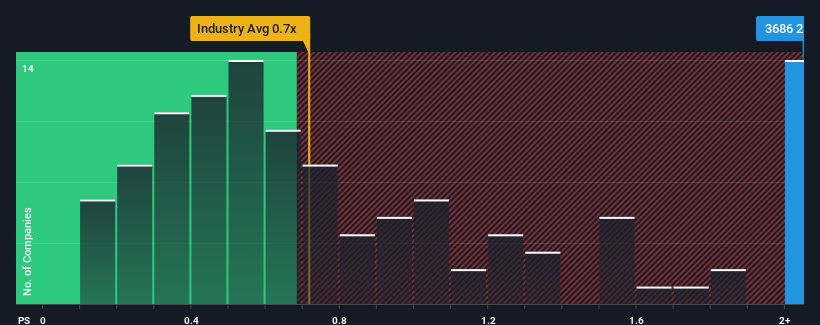
In spite of the heavy fall in price, you could still be forgiven for thinking DLE is a stock not worth researching with a price-to-sales ratios (or "P/S") of 2x, considering almost half the companies in Japan's Media industry have P/S ratios below 0.7x. Although, it's not wise to just take the P/S at face value as there may be an explanation why it's as high as it is.
View our latest analysis for DLE
How DLE Has Been Performing
Revenue has risen at a steady rate over the last year for DLE, which is generally not a bad outcome. Perhaps the market believes the recent revenue performance is strong enough to outperform the industry, which has inflated the P/S ratio. If not, then existing shareholders may be a little nervous about the viability of the share price.
Want the full picture on earnings, revenue and cash flow for the company? Then our free report on DLE will help you shine a light on its historical performance.Do Revenue Forecasts Match The High P/S Ratio?
There's an inherent assumption that a company should outperform the industry for P/S ratios like DLE's to be considered reasonable.
Retrospectively, the last year delivered a decent 3.0% gain to the company's revenues. Revenue has also lifted 24% in aggregate from three years ago, partly thanks to the last 12 months of growth. So we can start by confirming that the company has actually done a good job of growing revenue over that time.
Comparing that to the industry, which is predicted to deliver 35% growth in the next 12 months, the company's momentum is weaker, based on recent medium-term annualised revenue results.
With this in mind, we find it worrying that DLE's P/S exceeds that of its industry peers. Apparently many investors in the company are way more bullish than recent times would indicate and aren't willing to let go of their stock at any price. Only the boldest would assume these prices are sustainable as a continuation of recent revenue trends is likely to weigh heavily on the share price eventually.
What We Can Learn From DLE's P/S?
There's still some elevation in DLE's P/S, even if the same can't be said for its share price recently. While the price-to-sales ratio shouldn't be the defining factor in whether you buy a stock or not, it's quite a capable barometer of revenue expectations.
The fact that DLE currently trades on a higher P/S relative to the industry is an oddity, since its recent three-year growth is lower than the wider industry forecast. When we see slower than industry revenue growth but an elevated P/S, there's considerable risk of the share price declining, sending the P/S lower. Unless there is a significant improvement in the company's medium-term performance, it will be difficult to prevent the P/S ratio from declining to a more reasonable level.
There are also other vital risk factors to consider and we've discovered 3 warning signs for DLE (2 are significant!) that you should be aware of before investing here.
If these risks are making you reconsider your opinion on DLE, explore our interactive list of high quality stocks to get an idea of what else is out there.
If you're looking to trade DLE, open an account with the lowest-cost platform trusted by professionals, Interactive Brokers.
With clients in over 200 countries and territories, and access to 160 markets, IBKR lets you trade stocks, options, futures, forex, bonds and funds from a single integrated account.
Enjoy no hidden fees, no account minimums, and FX conversion rates as low as 0.03%, far better than what most brokers offer.
Sponsored ContentNew: Manage All Your Stock Portfolios in One Place
We've created the ultimate portfolio companion for stock investors, and it's free.
• Connect an unlimited number of Portfolios and see your total in one currency
• Be alerted to new Warning Signs or Risks via email or mobile
• Track the Fair Value of your stocks
Have feedback on this article? Concerned about the content? Get in touch with us directly. Alternatively, email editorial-team (at) simplywallst.com.
This article by Simply Wall St is general in nature. We provide commentary based on historical data and analyst forecasts only using an unbiased methodology and our articles are not intended to be financial advice. It does not constitute a recommendation to buy or sell any stock, and does not take account of your objectives, or your financial situation. We aim to bring you long-term focused analysis driven by fundamental data. Note that our analysis may not factor in the latest price-sensitive company announcements or qualitative material. Simply Wall St has no position in any stocks mentioned.
About TSE:3686
Flawless balance sheet low.
Market Insights

Community Narratives
