
Advertisement
There's Reason For Concern Over Cross Marketing Group Inc.'s (TSE:3675) Massive 25% Price Jump
Cross Marketing Group Inc. (TSE:3675) shareholders would be excited to see that the share price has had a great month, posting a 25% gain and recovering from prior weakness. Unfortunately, the gains of the last month did little to right the losses of the last year with the stock still down 22% over that time.
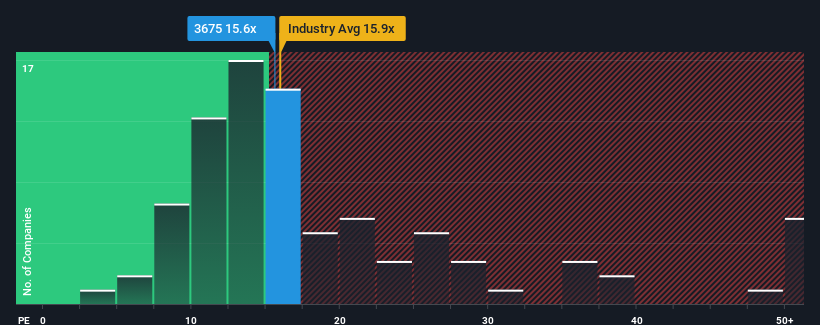
In spite of the firm bounce in price, you could still be forgiven for feeling indifferent about Cross Marketing Group's P/E ratio of 15.6x, since the median price-to-earnings (or "P/E") ratio in Japan is also close to 14x. While this might not raise any eyebrows, if the P/E ratio is not justified investors could be missing out on a potential opportunity or ignoring looming disappointment.
For instance, Cross Marketing Group's receding earnings in recent times would have to be some food for thought. One possibility is that the P/E is moderate because investors think the company might still do enough to be in line with the broader market in the near future. If not, then existing shareholders may be a little nervous about the viability of the share price.
View our latest analysis for Cross Marketing Group
How Is Cross Marketing Group's Growth Trending?
Cross Marketing Group's P/E ratio would be typical for a company that's only expected to deliver moderate growth, and importantly, perform in line with the market.
Taking a look back first, the company's earnings per share growth last year wasn't something to get excited about as it posted a disappointing decline of 24%. This has soured the latest three-year period, which nevertheless managed to deliver a decent 6.4% overall rise in EPS. Accordingly, while they would have preferred to keep the run going, shareholders would be roughly satisfied with the medium-term rates of earnings growth.
Weighing that recent medium-term earnings trajectory against the broader market's one-year forecast for expansion of 9.9% shows it's noticeably less attractive on an annualised basis.
With this information, we find it interesting that Cross Marketing Group is trading at a fairly similar P/E to the market. It seems most investors are ignoring the fairly limited recent growth rates and are willing to pay up for exposure to the stock. They may be setting themselves up for future disappointment if the P/E falls to levels more in line with recent growth rates.
The Final Word
Cross Marketing Group's stock has a lot of momentum behind it lately, which has brought its P/E level with the market. Using the price-to-earnings ratio alone to determine if you should sell your stock isn't sensible, however it can be a practical guide to the company's future prospects.
We've established that Cross Marketing Group currently trades on a higher than expected P/E since its recent three-year growth is lower than the wider market forecast. Right now we are uncomfortable with the P/E as this earnings performance isn't likely to support a more positive sentiment for long. Unless the recent medium-term conditions improve, it's challenging to accept these prices as being reasonable.
It's always necessary to consider the ever-present spectre of investment risk. We've identified 2 warning signs with Cross Marketing Group, and understanding these should be part of your investment process.
Of course, you might find a fantastic investment by looking at a few good candidates. So take a peek at this free list of companies with a strong growth track record, trading on a low P/E.
New: AI Stock Screener & Alerts
Our new AI Stock Screener scans the market every day to uncover opportunities.
• Dividend Powerhouses (3%+ Yield)
• Undervalued Small Caps with Insider Buying
• High growth Tech and AI Companies
Or build your own from over 50 metrics.
Have feedback on this article? Concerned about the content? Get in touch with us directly. Alternatively, email editorial-team (at) simplywallst.com.
This article by Simply Wall St is general in nature. We provide commentary based on historical data and analyst forecasts only using an unbiased methodology and our articles are not intended to be financial advice. It does not constitute a recommendation to buy or sell any stock, and does not take account of your objectives, or your financial situation. We aim to bring you long-term focused analysis driven by fundamental data. Note that our analysis may not factor in the latest price-sensitive company announcements or qualitative material. Simply Wall St has no position in any stocks mentioned.
Have feedback on this article? Concerned about the content? Get in touch with us directly. Alternatively, email editorial-team@simplywallst.com
About TSE:3675
Cross Marketing Group
Through its subsidiaries, provides market research and IT solutions-related services worldwide.
Flawless balance sheet, good value and pays a dividend.
Market Insights

Advertisement
Community Narratives
A formidable player in AI and enterprise computing.
Fair Value US$210.00|2.3% overvalued
CO
Community Contributor
IREN's Bold Moves in Sustainable Bitcoin Mining & AI Data Centers
Fair Value US$72.52|17.6% undervalued
BL
Community Contributor
Cooling the Champions: The Aussie Tech Behind F1's Victories
Fair Value AU$12.40|40.4% undervalued
TR
Community Contributor