
Advertisement

Soft earnings didn't appear to concern NEXON Co., Ltd.'s (TSE:3659) shareholders over the last week. We did some digging, and we believe the earnings are stronger than they seem.
See our latest analysis for NEXON
A Closer Look At NEXON's Earnings
In high finance, the key ratio used to measure how well a company converts reported profits into free cash flow (FCF) is the accrual ratio (from cashflow). To get the accrual ratio we first subtract FCF from profit for a period, and then divide that number by the average operating assets for the period. You could think of the accrual ratio from cashflow as the 'non-FCF profit ratio'.
As a result, a negative accrual ratio is a positive for the company, and a positive accrual ratio is a negative. While having an accrual ratio above zero is of little concern, we do think it's worth noting when a company has a relatively high accrual ratio. Notably, there is some academic evidence that suggests that a high accrual ratio is a bad sign for near-term profits, generally speaking.
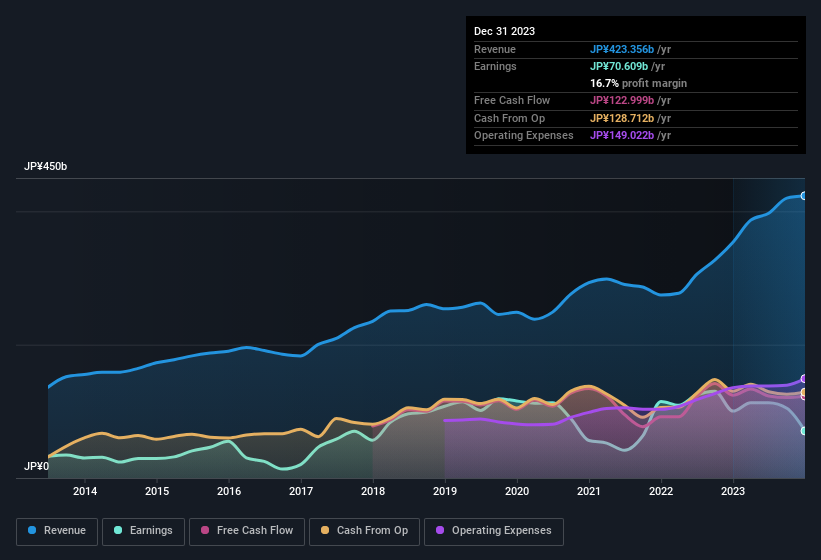
Over the twelve months to December 2023, NEXON recorded an accrual ratio of -0.19. That implies it has very good cash conversion, and that its earnings in the last year actually significantly understate its free cash flow. In fact, it had free cash flow of JP¥123b in the last year, which was a lot more than its statutory profit of JP¥70.6b. Over the last year, NEXON's free cash flow remained steady. However, that's not all there is to consider. The accrual ratio is reflecting the impact of unusual items on statutory profit, at least in part.
That might leave you wondering what analysts are forecasting in terms of future profitability. Luckily, you can click here to see an interactive graph depicting future profitability, based on their estimates.
The Impact Of Unusual Items On Profit
NEXON's profit was reduced by unusual items worth JP¥36b in the last twelve months, and this helped it produce high cash conversion, as reflected by its unusual items. This is what you'd expect to see where a company has a non-cash charge reducing paper profits. While deductions due to unusual items are disappointing in the first instance, there is a silver lining. When we analysed the vast majority of listed companies worldwide, we found that significant unusual items are often not repeated. And that's hardly a surprise given these line items are considered unusual. If NEXON doesn't see those unusual expenses repeat, then all else being equal we'd expect its profit to increase over the coming year.
Our Take On NEXON's Profit Performance
Considering both NEXON's accrual ratio and its unusual items, we think its statutory earnings are unlikely to exaggerate the company's underlying earnings power. After considering all this, we reckon NEXON's statutory profit probably understates its earnings potential! With this in mind, we wouldn't consider investing in a stock unless we had a thorough understanding of the risks. To that end, you should learn about the 3 warning signs we've spotted with NEXON (including 1 which shouldn't be ignored).
Our examination of NEXON has focussed on certain factors that can make its earnings look better than they are. And it has passed with flying colours. But there are plenty of other ways to inform your opinion of a company. Some people consider a high return on equity to be a good sign of a quality business. While it might take a little research on your behalf, you may find this free collection of companies boasting high return on equity, or this list of stocks that insiders are buying to be useful.
Valuation is complex, but we're here to simplify it.
Discover if NEXON might be undervalued or overvalued with our detailed analysis, featuring fair value estimates, potential risks, dividends, insider trades, and its financial condition.
Access Free AnalysisHave feedback on this article? Concerned about the content? Get in touch with us directly. Alternatively, email editorial-team (at) simplywallst.com.
This article by Simply Wall St is general in nature. We provide commentary based on historical data and analyst forecasts only using an unbiased methodology and our articles are not intended to be financial advice. It does not constitute a recommendation to buy or sell any stock, and does not take account of your objectives, or your financial situation. We aim to bring you long-term focused analysis driven by fundamental data. Note that our analysis may not factor in the latest price-sensitive company announcements or qualitative material. Simply Wall St has no position in any stocks mentioned.
About TSE:3659
NEXON
Produces, develops, distributes, and services PC online and mobile games in Japan and internationally.
Flawless balance sheet with proven track record.
Similar Companies
Market Insights


Advertisement
Community Narratives
Nike's Direct-to-Consumer Focus Will Drive Future Growth
Fair Value US$87.90|22.7% undervalued
UN
Community Contributor
Novo Nordisk will dominate GLP-1 market with Ozempic and Wegovy growth
Fair Value US$89.59|14.2% undervalued
BE
Community Contributor
Rheinmetall could get 20-25% of EU-NATO 3%-GDP defence spending
Fair Value €7.57k|82.8% undervalued
NO
Community Contributor