Is T. Hasegawa Co., Ltd.'s (TSE:4958) Recent Stock Performance Influenced By Its Fundamentals In Any Way?


T. Hasegawa (TSE:4958) has had a great run on the share market with its stock up by a significant 6.8% over the last week. We wonder if and what role the company's financials play in that price change as a company's long-term fundamentals usually dictate market outcomes. Specifically, we decided to study T. Hasegawa's ROE in this article.
Return on equity or ROE is an important factor to be considered by a shareholder because it tells them how effectively their capital is being reinvested. In short, ROE shows the profit each dollar generates with respect to its shareholder investments.
View our latest analysis for T. Hasegawa
How Do You Calculate Return On Equity?
Return on equity can be calculated by using the formula:
Return on Equity = Net Profit (from continuing operations) ÷ Shareholders' Equity
So, based on the above formula, the ROE for T. Hasegawa is:
6.0% = JP¥7.2b ÷ JP¥120b (Based on the trailing twelve months to September 2024).
The 'return' refers to a company's earnings over the last year. That means that for every ¥1 worth of shareholders' equity, the company generated ¥0.06 in profit.
Why Is ROE Important For Earnings Growth?
Thus far, we have learned that ROE measures how efficiently a company is generating its profits. Based on how much of its profits the company chooses to reinvest or "retain", we are then able to evaluate a company's future ability to generate profits. Assuming all else is equal, companies that have both a higher return on equity and higher profit retention are usually the ones that have a higher growth rate when compared to companies that don't have the same features.
T. Hasegawa's Earnings Growth And 6.0% ROE
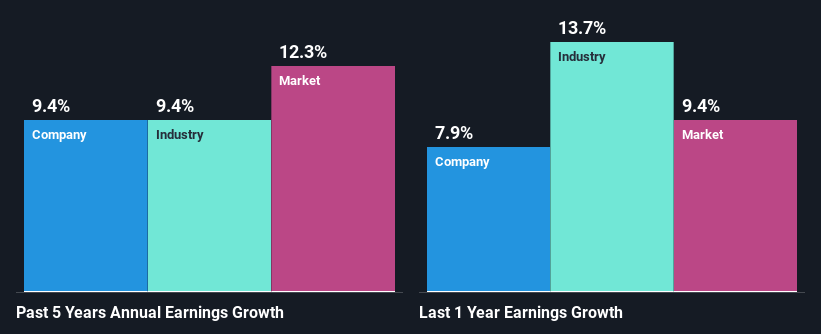
When you first look at it, T. Hasegawa's ROE doesn't look that attractive. However, given that the company's ROE is similar to the average industry ROE of 6.9%, we may spare it some thought. On the other hand, T. Hasegawa reported a moderate 9.4% net income growth over the past five years. Given the slightly low ROE, it is likely that there could be some other aspects that are driving this growth. For instance, the company has a low payout ratio or is being managed efficiently.
As a next step, we compared T. Hasegawa's net income growth with the industry and found that the company has a similar growth figure when compared with the industry average growth rate of 9.4% in the same period.
The basis for attaching value to a company is, to a great extent, tied to its earnings growth. What investors need to determine next is if the expected earnings growth, or the lack of it, is already built into the share price. This then helps them determine if the stock is placed for a bright or bleak future. Is T. Hasegawa fairly valued compared to other companies? These 3 valuation measures might help you decide.
Is T. Hasegawa Efficiently Re-investing Its Profits?
With a three-year median payout ratio of 36% (implying that the company retains 64% of its profits), it seems that T. Hasegawa is reinvesting efficiently in a way that it sees respectable amount growth in its earnings and pays a dividend that's well covered.
Additionally, T. Hasegawa has paid dividends over a period of at least ten years which means that the company is pretty serious about sharing its profits with shareholders.
Conclusion
On the whole, we do feel that T. Hasegawa has some positive attributes. Even in spite of the low rate of return, the company has posted impressive earnings growth as a result of reinvesting heavily into its business. That being so, a study of the latest analyst forecasts show that the company is expected to see a slowdown in its future earnings growth. To know more about the company's future earnings growth forecasts take a look at this free report on analyst forecasts for the company to find out more.
Valuation is complex, but we're here to simplify it.
Discover if T. Hasegawa might be undervalued or overvalued with our detailed analysis, featuring fair value estimates, potential risks, dividends, insider trades, and its financial condition.
Access Free AnalysisHave feedback on this article? Concerned about the content? Get in touch with us directly. Alternatively, email editorial-team (at) simplywallst.com.
This article by Simply Wall St is general in nature. We provide commentary based on historical data and analyst forecasts only using an unbiased methodology and our articles are not intended to be financial advice. It does not constitute a recommendation to buy or sell any stock, and does not take account of your objectives, or your financial situation. We aim to bring you long-term focused analysis driven by fundamental data. Note that our analysis may not factor in the latest price-sensitive company announcements or qualitative material. Simply Wall St has no position in any stocks mentioned.
About TSE:4958
T. Hasegawa
Engages in the production, sale, import, and export of fragrances, flavors, aromatic chemicals, food additives, and foods in Japan and internationally.
Flawless balance sheet established dividend payer.
Similar Companies
Market Insights

Community Narratives

