
Advertisement
Warren Buffett famously said, 'Volatility is far from synonymous with risk.' It's only natural to consider a company's balance sheet when you examine how risky it is, since debt is often involved when a business collapses. Importantly, Unicharm Corporation (TSE:8113) does carry debt. But is this debt a concern to shareholders?
What Risk Does Debt Bring?
Debt assists a business until the business has trouble paying it off, either with new capital or with free cash flow. In the worst case scenario, a company can go bankrupt if it cannot pay its creditors. While that is not too common, we often do see indebted companies permanently diluting shareholders because lenders force them to raise capital at a distressed price. Of course, plenty of companies use debt to fund growth, without any negative consequences. When we examine debt levels, we first consider both cash and debt levels, together.
See our latest analysis for Unicharm
How Much Debt Does Unicharm Carry?
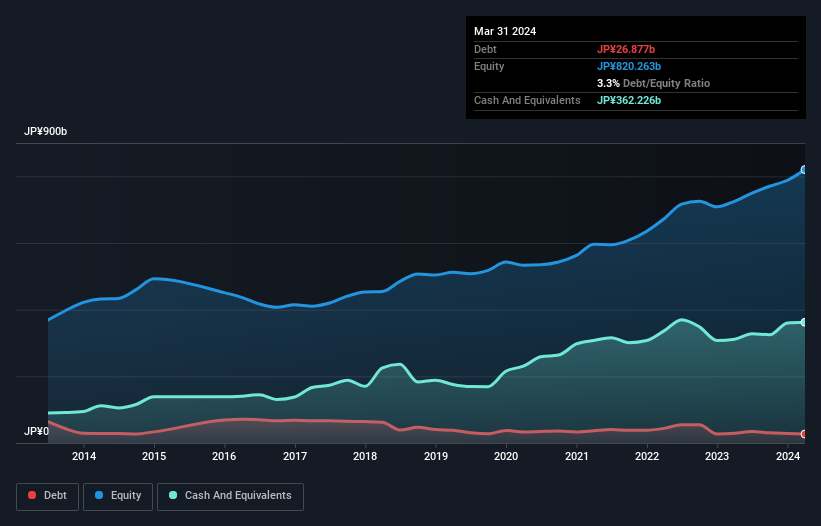
As you can see below, Unicharm had JP¥26.9b of debt at March 2024, down from JP¥29.1b a year prior. But on the other hand it also has JP¥362.2b in cash, leading to a JP¥335.3b net cash position.
How Strong Is Unicharm's Balance Sheet?
We can see from the most recent balance sheet that Unicharm had liabilities of JP¥257.1b falling due within a year, and liabilities of JP¥82.2b due beyond that. On the other hand, it had cash of JP¥362.2b and JP¥146.0b worth of receivables due within a year. So it actually has JP¥168.8b more liquid assets than total liabilities.
This surplus suggests that Unicharm has a conservative balance sheet, and could probably eliminate its debt without much difficulty. Simply put, the fact that Unicharm has more cash than debt is arguably a good indication that it can manage its debt safely.
Another good sign is that Unicharm has been able to increase its EBIT by 22% in twelve months, making it easier to pay down debt. When analysing debt levels, the balance sheet is the obvious place to start. But it is future earnings, more than anything, that will determine Unicharm's ability to maintain a healthy balance sheet going forward. So if you're focused on the future you can check out this free report showing analyst profit forecasts.
Finally, a business needs free cash flow to pay off debt; accounting profits just don't cut it. Unicharm may have net cash on the balance sheet, but it is still interesting to look at how well the business converts its earnings before interest and tax (EBIT) to free cash flow, because that will influence both its need for, and its capacity to manage debt. During the last three years, Unicharm produced sturdy free cash flow equating to 70% of its EBIT, about what we'd expect. This free cash flow puts the company in a good position to pay down debt, when appropriate.
Summing Up
While we empathize with investors who find debt concerning, you should keep in mind that Unicharm has net cash of JP¥335.3b, as well as more liquid assets than liabilities. And it impressed us with its EBIT growth of 22% over the last year. So is Unicharm's debt a risk? It doesn't seem so to us. Above most other metrics, we think its important to track how fast earnings per share is growing, if at all. If you've also come to that realization, you're in luck, because today you can view this interactive graph of Unicharm's earnings per share history for free.
If, after all that, you're more interested in a fast growing company with a rock-solid balance sheet, then check out our list of net cash growth stocks without delay.
New: AI Stock Screener & Alerts
Our new AI Stock Screener scans the market every day to uncover opportunities.
• Dividend Powerhouses (3%+ Yield)
• Undervalued Small Caps with Insider Buying
• High growth Tech and AI Companies
Or build your own from over 50 metrics.
Have feedback on this article? Concerned about the content? Get in touch with us directly. Alternatively, email editorial-team (at) simplywallst.com.
This article by Simply Wall St is general in nature. We provide commentary based on historical data and analyst forecasts only using an unbiased methodology and our articles are not intended to be financial advice. It does not constitute a recommendation to buy or sell any stock, and does not take account of your objectives, or your financial situation. We aim to bring you long-term focused analysis driven by fundamental data. Note that our analysis may not factor in the latest price-sensitive company announcements or qualitative material. Simply Wall St has no position in any stocks mentioned.
Have feedback on this article? Concerned about the content? Get in touch with us directly. Alternatively, email editorial-team@simplywallst.com
About TSE:8113
Unicharm
Engages in sale of wellness care products, pet care and feminine care products, baby and child care products, kirei care products, food-packaging materials, etc.
Flawless balance sheet and fair value.
Similar Companies
Market Insights

Advertisement
Community Narratives

BMW cruising ahead with new EVs and premium models to boost revenue 5%
Fair Value €135.07|45.0% undervalued
UN
Community Contributor
EU#2 - From Humble Beginnings to Global Powerhouse
Fair Value DKK 851.04|47.8% undervalued
TO
Community Contributor