

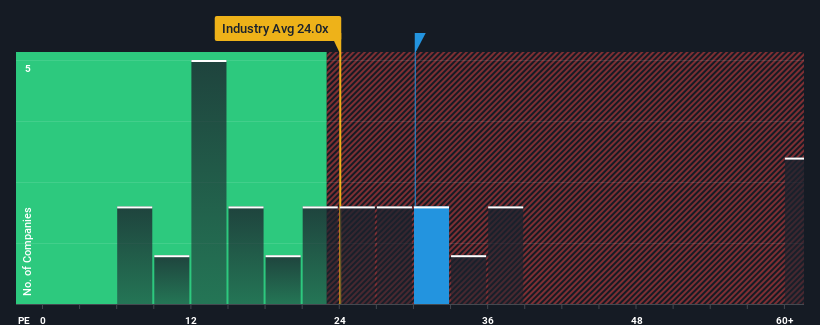
Fancl Corporation's (TSE:4921) price-to-earnings (or "P/E") ratio of 30.1x might make it look like a strong sell right now compared to the market in Japan, where around half of the companies have P/E ratios below 14x and even P/E's below 9x are quite common. However, the P/E might be quite high for a reason and it requires further investigation to determine if it's justified.
With earnings growth that's superior to most other companies of late, Fancl has been doing relatively well. The P/E is probably high because investors think this strong earnings performance will continue. If not, then existing shareholders might be a little nervous about the viability of the share price.
See our latest analysis for Fancl
What Are Growth Metrics Telling Us About The High P/E?
Fancl's P/E ratio would be typical for a company that's expected to deliver very strong growth, and importantly, perform much better than the market.
Retrospectively, the last year delivered an exceptional 43% gain to the company's bottom line. Still, EPS has barely risen at all from three years ago in total, which is not ideal. So it appears to us that the company has had a mixed result in terms of growing earnings over that time.
Looking ahead now, EPS is anticipated to climb by 18% each year during the coming three years according to the six analysts following the company. Meanwhile, the rest of the market is forecast to only expand by 11% per year, which is noticeably less attractive.
With this information, we can see why Fancl is trading at such a high P/E compared to the market. Apparently shareholders aren't keen to offload something that is potentially eyeing a more prosperous future.
The Bottom Line On Fancl's P/E
Generally, our preference is to limit the use of the price-to-earnings ratio to establishing what the market thinks about the overall health of a company.
As we suspected, our examination of Fancl's analyst forecasts revealed that its superior earnings outlook is contributing to its high P/E. Right now shareholders are comfortable with the P/E as they are quite confident future earnings aren't under threat. It's hard to see the share price falling strongly in the near future under these circumstances.
Many other vital risk factors can be found on the company's balance sheet. You can assess many of the main risks through our free balance sheet analysis for Fancl with six simple checks.
If these risks are making you reconsider your opinion on Fancl, explore our interactive list of high quality stocks to get an idea of what else is out there.
If you're looking to trade Fancl, open an account with the lowest-cost platform trusted by professionals, Interactive Brokers.
With clients in over 200 countries and territories, and access to 160 markets, IBKR lets you trade stocks, options, futures, forex, bonds and funds from a single integrated account.
Enjoy no hidden fees, no account minimums, and FX conversion rates as low as 0.03%, far better than what most brokers offer.
Sponsored ContentNew: AI Stock Screener & Alerts
Our new AI Stock Screener scans the market every day to uncover opportunities.
• Dividend Powerhouses (3%+ Yield)
• Undervalued Small Caps with Insider Buying
• High growth Tech and AI Companies
Or build your own from over 50 metrics.
Have feedback on this article? Concerned about the content? Get in touch with us directly. Alternatively, email editorial-team (at) simplywallst.com.
This article by Simply Wall St is general in nature. We provide commentary based on historical data and analyst forecasts only using an unbiased methodology and our articles are not intended to be financial advice. It does not constitute a recommendation to buy or sell any stock, and does not take account of your objectives, or your financial situation. We aim to bring you long-term focused analysis driven by fundamental data. Note that our analysis may not factor in the latest price-sensitive company announcements or qualitative material. Simply Wall St has no position in any stocks mentioned.
About TSE:4921
Fancl
Engages in the research and development, manufacture, and sale of cosmetics and health food products in Japan, China, North America, Europe, the Middle East, Asia, and Oceania.
Flawless balance sheet with proven track record.
Market Insights

Community Narratives


