

Some say volatility, rather than debt, is the best way to think about risk as an investor, but Warren Buffett famously said that 'Volatility is far from synonymous with risk.' So it might be obvious that you need to consider debt, when you think about how risky any given stock is, because too much debt can sink a company. As with many other companies Kao Corporation (TSE:4452) makes use of debt. But the more important question is: how much risk is that debt creating?
Why Does Debt Bring Risk?
Debt is a tool to help businesses grow, but if a business is incapable of paying off its lenders, then it exists at their mercy. If things get really bad, the lenders can take control of the business. However, a more common (but still painful) scenario is that it has to raise new equity capital at a low price, thus permanently diluting shareholders. Having said that, the most common situation is where a company manages its debt reasonably well - and to its own advantage. When we examine debt levels, we first consider both cash and debt levels, together.
View our latest analysis for Kao
What Is Kao's Net Debt?
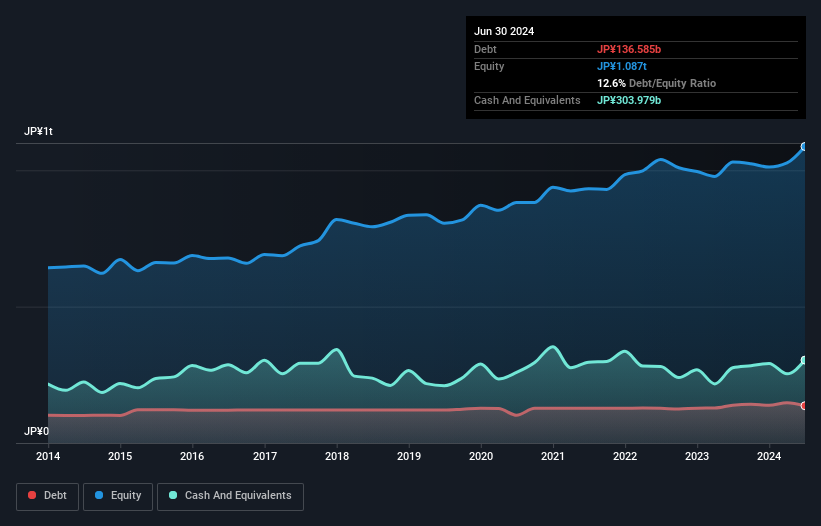
The chart below, which you can click on for greater detail, shows that Kao had JP¥136.6b in debt in June 2024; about the same as the year before. But on the other hand it also has JP¥304.0b in cash, leading to a JP¥167.4b net cash position.
How Healthy Is Kao's Balance Sheet?
Zooming in on the latest balance sheet data, we can see that Kao had liabilities of JP¥464.2b due within 12 months and liabilities of JP¥296.5b due beyond that. On the other hand, it had cash of JP¥304.0b and JP¥247.4b worth of receivables due within a year. So its liabilities total JP¥209.3b more than the combination of its cash and short-term receivables.
Since publicly traded Kao shares are worth a very impressive total of JP¥3.20t, it seems unlikely that this level of liabilities would be a major threat. However, we do think it is worth keeping an eye on its balance sheet strength, as it may change over time. While it does have liabilities worth noting, Kao also has more cash than debt, so we're pretty confident it can manage its debt safely.
In addition to that, we're happy to report that Kao has boosted its EBIT by 54%, thus reducing the spectre of future debt repayments. There's no doubt that we learn most about debt from the balance sheet. But ultimately the future profitability of the business will decide if Kao can strengthen its balance sheet over time. So if you're focused on the future you can check out this free report showing analyst profit forecasts.
Finally, a company can only pay off debt with cold hard cash, not accounting profits. Kao may have net cash on the balance sheet, but it is still interesting to look at how well the business converts its earnings before interest and tax (EBIT) to free cash flow, because that will influence both its need for, and its capacity to manage debt. Over the last three years, Kao recorded free cash flow worth a fulsome 85% of its EBIT, which is stronger than we'd usually expect. That puts it in a very strong position to pay down debt.
Summing Up
We could understand if investors are concerned about Kao's liabilities, but we can be reassured by the fact it has has net cash of JP¥167.4b. And it impressed us with free cash flow of JP¥140b, being 85% of its EBIT. So is Kao's debt a risk? It doesn't seem so to us. There's no doubt that we learn most about debt from the balance sheet. However, not all investment risk resides within the balance sheet - far from it. To that end, you should be aware of the 2 warning signs we've spotted with Kao .
When all is said and done, sometimes its easier to focus on companies that don't even need debt. Readers can access a list of growth stocks with zero net debt 100% free, right now.
Valuation is complex, but we're here to simplify it.
Discover if Kao might be undervalued or overvalued with our detailed analysis, featuring fair value estimates, potential risks, dividends, insider trades, and its financial condition.
Access Free AnalysisHave feedback on this article? Concerned about the content? Get in touch with us directly. Alternatively, email editorial-team (at) simplywallst.com.
This article by Simply Wall St is general in nature. We provide commentary based on historical data and analyst forecasts only using an unbiased methodology and our articles are not intended to be financial advice. It does not constitute a recommendation to buy or sell any stock, and does not take account of your objectives, or your financial situation. We aim to bring you long-term focused analysis driven by fundamental data. Note that our analysis may not factor in the latest price-sensitive company announcements or qualitative material. Simply Wall St has no position in any stocks mentioned.
About TSE:4452
Kao
Develops and sells hygiene and living care, health and beauty care, life care, cosmetics, and chemical products.
Flawless balance sheet established dividend payer.
Similar Companies
Market Insights

Community Narratives

