
Advertisement
- Japan
- /
- Personal Products
- /
- TSE:4452
Investors in Kao (TSE:4452) have seen decent returns of 34% over the past three years

Low-cost index funds make it easy to achieve average market returns. But in any diversified portfolio of stocks, you'll see some that fall short of the average. For example, the Kao Corporation (TSE:4452) share price return of 24% over three years lags the market return in the same period. Looking at more recent returns, the stock is up 15% in a year.
Let's take a look at the underlying fundamentals over the longer term, and see if they've been consistent with shareholders returns.
See our latest analysis for Kao
While markets are a powerful pricing mechanism, share prices reflect investor sentiment, not just underlying business performance. One imperfect but simple way to consider how the market perception of a company has shifted is to compare the change in the earnings per share (EPS) with the share price movement.
During three years of share price growth, Kao achieved compound earnings per share growth of 0.2% per year. This EPS growth is lower than the 7% average annual increase in the share price. This suggests that, as the business progressed over the last few years, it gained the confidence of market participants. It is quite common to see investors become enamoured with a business, after a few years of solid progress.
You can see below how EPS has changed over time (discover the exact values by clicking on the image).
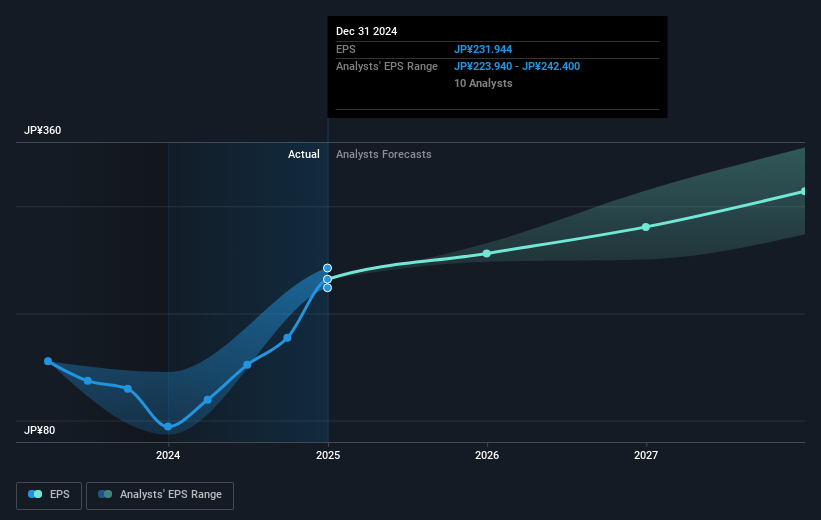
We know that Kao has improved its bottom line lately, but is it going to grow revenue? You could check out this free report showing analyst revenue forecasts.
What About Dividends?
It is important to consider the total shareholder return, as well as the share price return, for any given stock. Whereas the share price return only reflects the change in the share price, the TSR includes the value of dividends (assuming they were reinvested) and the benefit of any discounted capital raising or spin-off. It's fair to say that the TSR gives a more complete picture for stocks that pay a dividend. As it happens, Kao's TSR for the last 3 years was 34%, which exceeds the share price return mentioned earlier. The dividends paid by the company have thusly boosted the total shareholder return.
A Different Perspective
It's good to see that Kao has rewarded shareholders with a total shareholder return of 18% in the last twelve months. That's including the dividend. That certainly beats the loss of about 1.3% per year over the last half decade. This makes us a little wary, but the business might have turned around its fortunes. Before forming an opinion on Kao you might want to consider these 3 valuation metrics.
We will like Kao better if we see some big insider buys. While we wait, check out this free list of undervalued stocks (mostly small caps) with considerable, recent, insider buying.
Please note, the market returns quoted in this article reflect the market weighted average returns of stocks that currently trade on Japanese exchanges.
Valuation is complex, but we're here to simplify it.
Discover if Kao might be undervalued or overvalued with our detailed analysis, featuring fair value estimates, potential risks, dividends, insider trades, and its financial condition.
Access Free AnalysisHave feedback on this article? Concerned about the content? Get in touch with us directly. Alternatively, email editorial-team (at) simplywallst.com.
This article by Simply Wall St is general in nature. We provide commentary based on historical data and analyst forecasts only using an unbiased methodology and our articles are not intended to be financial advice. It does not constitute a recommendation to buy or sell any stock, and does not take account of your objectives, or your financial situation. We aim to bring you long-term focused analysis driven by fundamental data. Note that our analysis may not factor in the latest price-sensitive company announcements or qualitative material. Simply Wall St has no position in any stocks mentioned.
About TSE:4452
Kao
Develops and sells hygiene and living care, health and beauty care, life care, cosmetics, and chemical products.
Flawless balance sheet established dividend payer.
Similar Companies
Market Insights

Advertisement
Community Narratives
Groundbreaking therapies that could change the treatment landscape for PTSD, fibromyalgia, MS & Alzheimer’s
Fair Value US$6.20|86.9% undervalued
CM
Community Contributor
DigitalOcean Will Grow 14% by Embracing AI with Paperspace Acquisition
Fair Value US$50.00|42.8% undervalued
NE
Community Contributor
Viant Technology: A Rising AdTech Challenger in the AI-Powered CTV Market
Fair Value US$38.61|66.0% undervalued
BL
Community Contributor
Volvo will Accelerate Forward into Electric and Autonomous Leadership in Five Years
Fair Value SEK 438.80|40.8% undervalued
UN
Community Contributor