- Japan
- /
- Healthcare Services
- /
- TSE:4544
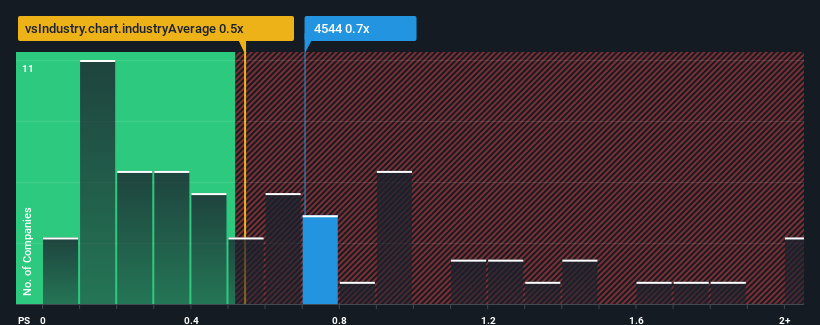
Revenues Not Telling The Story For H.U. Group Holdings, Inc. (TSE:4544)


It's not a stretch to say that H.U. Group Holdings, Inc.'s (TSE:4544) price-to-sales (or "P/S") ratio of 0.7x right now seems quite "middle-of-the-road" for companies in the Healthcare industry in Japan, where the median P/S ratio is around 0.5x. However, investors might be overlooking a clear opportunity or potential setback if there is no rational basis for the P/S.
We've discovered 1 warning sign about H.U. Group Holdings. View them for free.View our latest analysis for H.U. Group Holdings
What Does H.U. Group Holdings' Recent Performance Look Like?
H.U. Group Holdings could be doing better as it's been growing revenue less than most other companies lately. Perhaps the market is expecting future revenue performance to lift, which has kept the P/S from declining. However, if this isn't the case, investors might get caught out paying too much for the stock.
If you'd like to see what analysts are forecasting going forward, you should check out our free report on H.U. Group Holdings.Do Revenue Forecasts Match The P/S Ratio?
In order to justify its P/S ratio, H.U. Group Holdings would need to produce growth that's similar to the industry.
Retrospectively, the last year delivered virtually the same number to the company's top line as the year before. This isn't what shareholders were looking for as it means they've been left with a 7.1% decline in revenue over the last three years in total. Therefore, it's fair to say the revenue growth recently has been undesirable for the company.
Turning to the outlook, the next year should generate growth of 1.9% as estimated by the four analysts watching the company. Meanwhile, the rest of the industry is forecast to expand by 5.9%, which is noticeably more attractive.
In light of this, it's curious that H.U. Group Holdings' P/S sits in line with the majority of other companies. It seems most investors are ignoring the fairly limited growth expectations and are willing to pay up for exposure to the stock. Maintaining these prices will be difficult to achieve as this level of revenue growth is likely to weigh down the shares eventually.
What Does H.U. Group Holdings' P/S Mean For Investors?
While the price-to-sales ratio shouldn't be the defining factor in whether you buy a stock or not, it's quite a capable barometer of revenue expectations.
When you consider that H.U. Group Holdings' revenue growth estimates are fairly muted compared to the broader industry, it's easy to see why we consider it unexpected to be trading at its current P/S ratio. At present, we aren't confident in the P/S as the predicted future revenues aren't likely to support a more positive sentiment for long. A positive change is needed in order to justify the current price-to-sales ratio.
Having said that, be aware H.U. Group Holdings is showing 1 warning sign in our investment analysis, you should know about.
If strong companies turning a profit tickle your fancy, then you'll want to check out this free list of interesting companies that trade on a low P/E (but have proven they can grow earnings).
If you're looking to trade H.U. Group Holdings, open an account with the lowest-cost platform trusted by professionals, Interactive Brokers.
With clients in over 200 countries and territories, and access to 160 markets, IBKR lets you trade stocks, options, futures, forex, bonds and funds from a single integrated account.
Enjoy no hidden fees, no account minimums, and FX conversion rates as low as 0.03%, far better than what most brokers offer.
Sponsored ContentValuation is complex, but we're here to simplify it.
Discover if H.U. Group Holdings might be undervalued or overvalued with our detailed analysis, featuring fair value estimates, potential risks, dividends, insider trades, and its financial condition.
Access Free AnalysisHave feedback on this article? Concerned about the content? Get in touch with us directly. Alternatively, email editorial-team (at) simplywallst.com.
This article by Simply Wall St is general in nature. We provide commentary based on historical data and analyst forecasts only using an unbiased methodology and our articles are not intended to be financial advice. It does not constitute a recommendation to buy or sell any stock, and does not take account of your objectives, or your financial situation. We aim to bring you long-term focused analysis driven by fundamental data. Note that our analysis may not factor in the latest price-sensitive company announcements or qualitative material. Simply Wall St has no position in any stocks mentioned.
About TSE:4544
H.U. Group Holdings
Operates healthcare business in Japan, the United States, Europe, and internationally.
Excellent balance sheet and good value.
Similar Companies
Market Insights

Community Narratives


