
Advertisement

The market was pleased with the recent earnings report from CE Holdings Co.,Ltd. (TSE:4320), despite the profit numbers being soft. Our analysis suggests that investors may have noticed some promising signs beyond the statutory profit figures.
We've discovered 2 warning signs about CE HoldingsLtd. View them for free.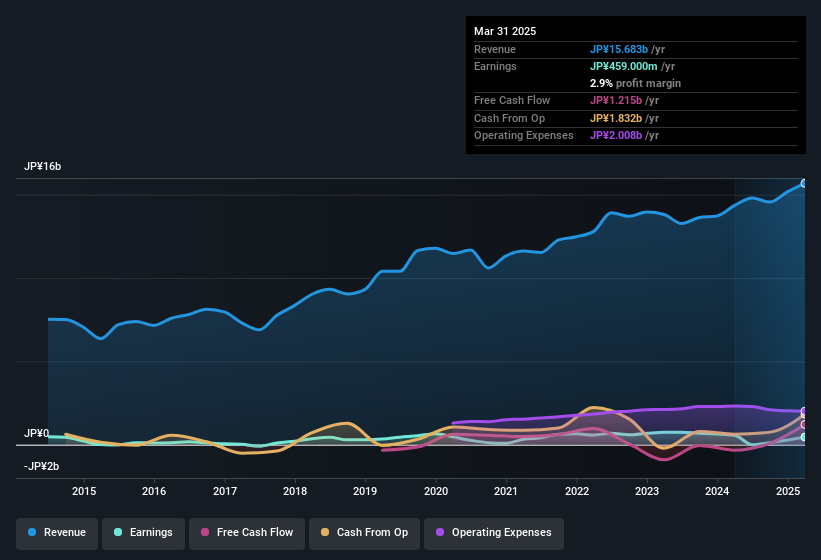
Zooming In On CE HoldingsLtd's Earnings
One key financial ratio used to measure how well a company converts its profit to free cash flow (FCF) is the accrual ratio. To get the accrual ratio we first subtract FCF from profit for a period, and then divide that number by the average operating assets for the period. This ratio tells us how much of a company's profit is not backed by free cashflow.
As a result, a negative accrual ratio is a positive for the company, and a positive accrual ratio is a negative. That is not intended to imply we should worry about a positive accrual ratio, but it's worth noting where the accrual ratio is rather high. Notably, there is some academic evidence that suggests that a high accrual ratio is a bad sign for near-term profits, generally speaking.
Over the twelve months to March 2025, CE HoldingsLtd recorded an accrual ratio of -0.13. Therefore, its statutory earnings were quite a lot less than its free cashflow. Indeed, in the last twelve months it reported free cash flow of JP¥1.2b, well over the JP¥459.0m it reported in profit. Given that CE HoldingsLtd had negative free cash flow in the prior corresponding period, the trailing twelve month resul of JP¥1.2b would seem to be a step in the right direction. However, that's not all there is to consider. We can see that unusual items have impacted its statutory profit, and therefore the accrual ratio.
View our latest analysis for CE HoldingsLtd
Note: we always recommend investors check balance sheet strength. Click here to be taken to our balance sheet analysis of CE HoldingsLtd.
The Impact Of Unusual Items On Profit
CE HoldingsLtd's profit was reduced by unusual items worth JP¥463m in the last twelve months, and this helped it produce high cash conversion, as reflected by its unusual items. This is what you'd expect to see where a company has a non-cash charge reducing paper profits. It's never great to see unusual items costing the company profits, but on the upside, things might improve sooner rather than later. We looked at thousands of listed companies and found that unusual items are very often one-off in nature. And that's hardly a surprise given these line items are considered unusual. Assuming those unusual expenses don't come up again, we'd therefore expect CE HoldingsLtd to produce a higher profit next year, all else being equal.
Our Take On CE HoldingsLtd's Profit Performance
Considering both CE HoldingsLtd's accrual ratio and its unusual items, we think its statutory earnings are unlikely to exaggerate the company's underlying earnings power. Looking at all these factors, we'd say that CE HoldingsLtd's underlying earnings power is at least as good as the statutory numbers would make it seem. If you'd like to know more about CE HoldingsLtd as a business, it's important to be aware of any risks it's facing. Every company has risks, and we've spotted 2 warning signs for CE HoldingsLtd you should know about.
Our examination of CE HoldingsLtd has focussed on certain factors that can make its earnings look better than they are. And it has passed with flying colours. But there are plenty of other ways to inform your opinion of a company. Some people consider a high return on equity to be a good sign of a quality business. While it might take a little research on your behalf, you may find this free collection of companies boasting high return on equity, or this list of stocks with significant insider holdings to be useful.
New: AI Stock Screener & Alerts
Our new AI Stock Screener scans the market every day to uncover opportunities.
• Dividend Powerhouses (3%+ Yield)
• Undervalued Small Caps with Insider Buying
• High growth Tech and AI Companies
Or build your own from over 50 metrics.
Have feedback on this article? Concerned about the content? Get in touch with us directly. Alternatively, email editorial-team (at) simplywallst.com.
This article by Simply Wall St is general in nature. We provide commentary based on historical data and analyst forecasts only using an unbiased methodology and our articles are not intended to be financial advice. It does not constitute a recommendation to buy or sell any stock, and does not take account of your objectives, or your financial situation. We aim to bring you long-term focused analysis driven by fundamental data. Note that our analysis may not factor in the latest price-sensitive company announcements or qualitative material. Simply Wall St has no position in any stocks mentioned.
About TSE:4320
CE HoldingsLtd
Through its subsidiaries, develops and sells electronic medical record systems and medical information systems in Japan.
Flawless balance sheet established dividend payer.
Market Insights

Advertisement
Community Narratives

Apple: A Dying Star with an Overpriced Valuation
Fair Value US$177.34|19.1% overvalued
IN
Community Contributor
Avino a case for USD$20 per share within 5 years (assuming $3,500 gold, $100 silver and $4 copper).
Fair Value CA$26.79|86.0% undervalued
AG
Community Contributor
Riding the Defense Boom RENK Sees Revenue Climb at 15% CAGR by FY 2029
Fair Value €69.87|14.3% undervalued
CH
Community Contributor