
Advertisement
- Japan
- /
- Healthtech
- /
- TSE:4320
CE Holdings Co.,Ltd. (TSE:4320) Stock Is Going Strong But Fundamentals Look Uncertain: What Lies Ahead ?

Most readers would already be aware that CE HoldingsLtd's (TSE:4320) stock increased significantly by 30% over the past three months. However, we decided to pay attention to the company's fundamentals which don't appear to give a clear sign about the company's financial health. Particularly, we will be paying attention to CE HoldingsLtd's ROE today.
Return on equity or ROE is an important factor to be considered by a shareholder because it tells them how effectively their capital is being reinvested. In simpler terms, it measures the profitability of a company in relation to shareholder's equity.
View our latest analysis for CE HoldingsLtd
How Do You Calculate Return On Equity?
ROE can be calculated by using the formula:
Return on Equity = Net Profit (from continuing operations) ÷ Shareholders' Equity
So, based on the above formula, the ROE for CE HoldingsLtd is:
2.9% = JP¥190m ÷ JP¥6.6b (Based on the trailing twelve months to September 2024).
The 'return' refers to a company's earnings over the last year. So, this means that for every ¥1 of its shareholder's investments, the company generates a profit of ¥0.03.
What Has ROE Got To Do With Earnings Growth?
Thus far, we have learned that ROE measures how efficiently a company is generating its profits. Based on how much of its profits the company chooses to reinvest or "retain", we are then able to evaluate a company's future ability to generate profits. Assuming all else is equal, companies that have both a higher return on equity and higher profit retention are usually the ones that have a higher growth rate when compared to companies that don't have the same features.
CE HoldingsLtd's Earnings Growth And 2.9% ROE
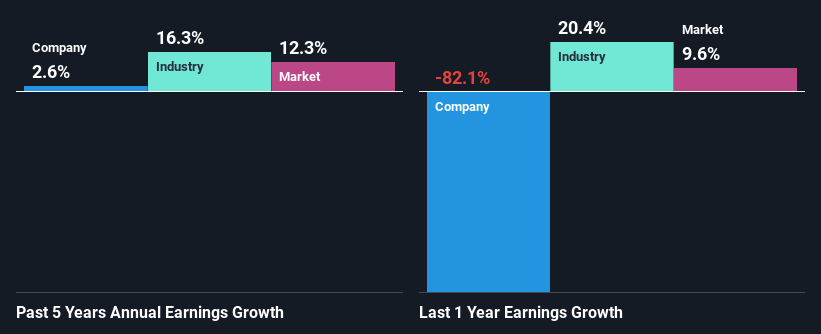
At first glance, CE HoldingsLtd's ROE doesn't look very promising. Next, when compared to the average industry ROE of 13%, the company's ROE leaves us feeling even less enthusiastic. Thus, the low net income growth of 2.6% seen by CE HoldingsLtd over the past five years could probably be the result of the low ROE.
As a next step, we compared CE HoldingsLtd's net income growth with the industry and were disappointed to see that the company's growth is lower than the industry average growth of 16% in the same period.
The basis for attaching value to a company is, to a great extent, tied to its earnings growth. The investor should try to establish if the expected growth or decline in earnings, whichever the case may be, is priced in. This then helps them determine if the stock is placed for a bright or bleak future. Is CE HoldingsLtd fairly valued compared to other companies? These 3 valuation measures might help you decide.
Is CE HoldingsLtd Using Its Retained Earnings Effectively?
A low three-year median payout ratio of 24% (implying that the company retains the remaining 76% of its income) suggests that CE HoldingsLtd is retaining most of its profits. However, the low earnings growth number doesn't reflect this as high growth usually follows high profit retention. So there could be some other explanation in that regard. For instance, the company's business may be deteriorating.
Additionally, CE HoldingsLtd has paid dividends over a period of at least ten years, which means that the company's management is determined to pay dividends even if it means little to no earnings growth.
Conclusion
In total, we're a bit ambivalent about CE HoldingsLtd's performance. While the company does have a high rate of profit retention, its low rate of return is probably hampering its earnings growth. Wrapping up, we would proceed with caution with this company and one way of doing that would be to look at the risk profile of the business. You can see the 5 risks we have identified for CE HoldingsLtd by visiting our risks dashboard for free on our platform here.
New: AI Stock Screener & Alerts
Our new AI Stock Screener scans the market every day to uncover opportunities.
• Dividend Powerhouses (3%+ Yield)
• Undervalued Small Caps with Insider Buying
• High growth Tech and AI Companies
Or build your own from over 50 metrics.
Have feedback on this article? Concerned about the content? Get in touch with us directly. Alternatively, email editorial-team (at) simplywallst.com.
This article by Simply Wall St is general in nature. We provide commentary based on historical data and analyst forecasts only using an unbiased methodology and our articles are not intended to be financial advice. It does not constitute a recommendation to buy or sell any stock, and does not take account of your objectives, or your financial situation. We aim to bring you long-term focused analysis driven by fundamental data. Note that our analysis may not factor in the latest price-sensitive company announcements or qualitative material. Simply Wall St has no position in any stocks mentioned.
About TSE:4320
CE HoldingsLtd
Through its subsidiaries, develops and sells electronic medical record systems and medical information systems in Japan.
Flawless balance sheet established dividend payer.
Market Insights


Advertisement
Community Narratives
MicroStrategy: Volatile Gamble or Golden Opportunity?
Fair Value US$663.00|32.0% undervalued
BL
Community Contributor
Emerging Markets and Debt Reduction Will Propel Bath & Body Works Forward
Fair Value US$40.73|21.7% undervalued
ZW
Community Contributor
An amazing opportunity to potentially get a 100 bagger
Fair Value US$10.00|0.5% overvalued
DA
Community Contributor