Advertisement
- China
- /
- Gas Utilities
- /
- SHSE:600803
3 Global Dividend Stocks With Up To 6% Yield

Simply Wall St
Reviewed by Simply Wall St
As global markets grapple with heightened trade tensions and economic uncertainty, investors are increasingly seeking stability amidst volatility. In this environment, dividend stocks can offer a reliable income stream, making them an attractive option for those looking to navigate the current market challenges.
Top 10 Dividend Stocks Globally
| Name | Dividend Yield | Dividend Rating |
| Totech (TSE:9960) | 4.21% | ★★★★★★ |
| Tsubakimoto Chain (TSE:6371) | 5.11% | ★★★★★★ |
| Nihon Parkerizing (TSE:4095) | 4.68% | ★★★★★★ |
| Intelligent Wave (TSE:4847) | 4.28% | ★★★★★★ |
| Allianz (XTRA:ALV) | 4.74% | ★★★★★★ |
| GakkyushaLtd (TSE:9769) | 4.38% | ★★★★★★ |
| E J Holdings (TSE:2153) | 5.23% | ★★★★★★ |
| Torigoe (TSE:2009) | 5.43% | ★★★★★★ |
| Japan Excellent (TSE:8987) | 4.65% | ★★★★★★ |
| Banque Cantonale Vaudoise (SWX:BCVN) | 4.74% | ★★★★★★ |
Click here to see the full list of 1580 stocks from our Top Global Dividend Stocks screener.
Here we highlight a subset of our preferred stocks from the screener.
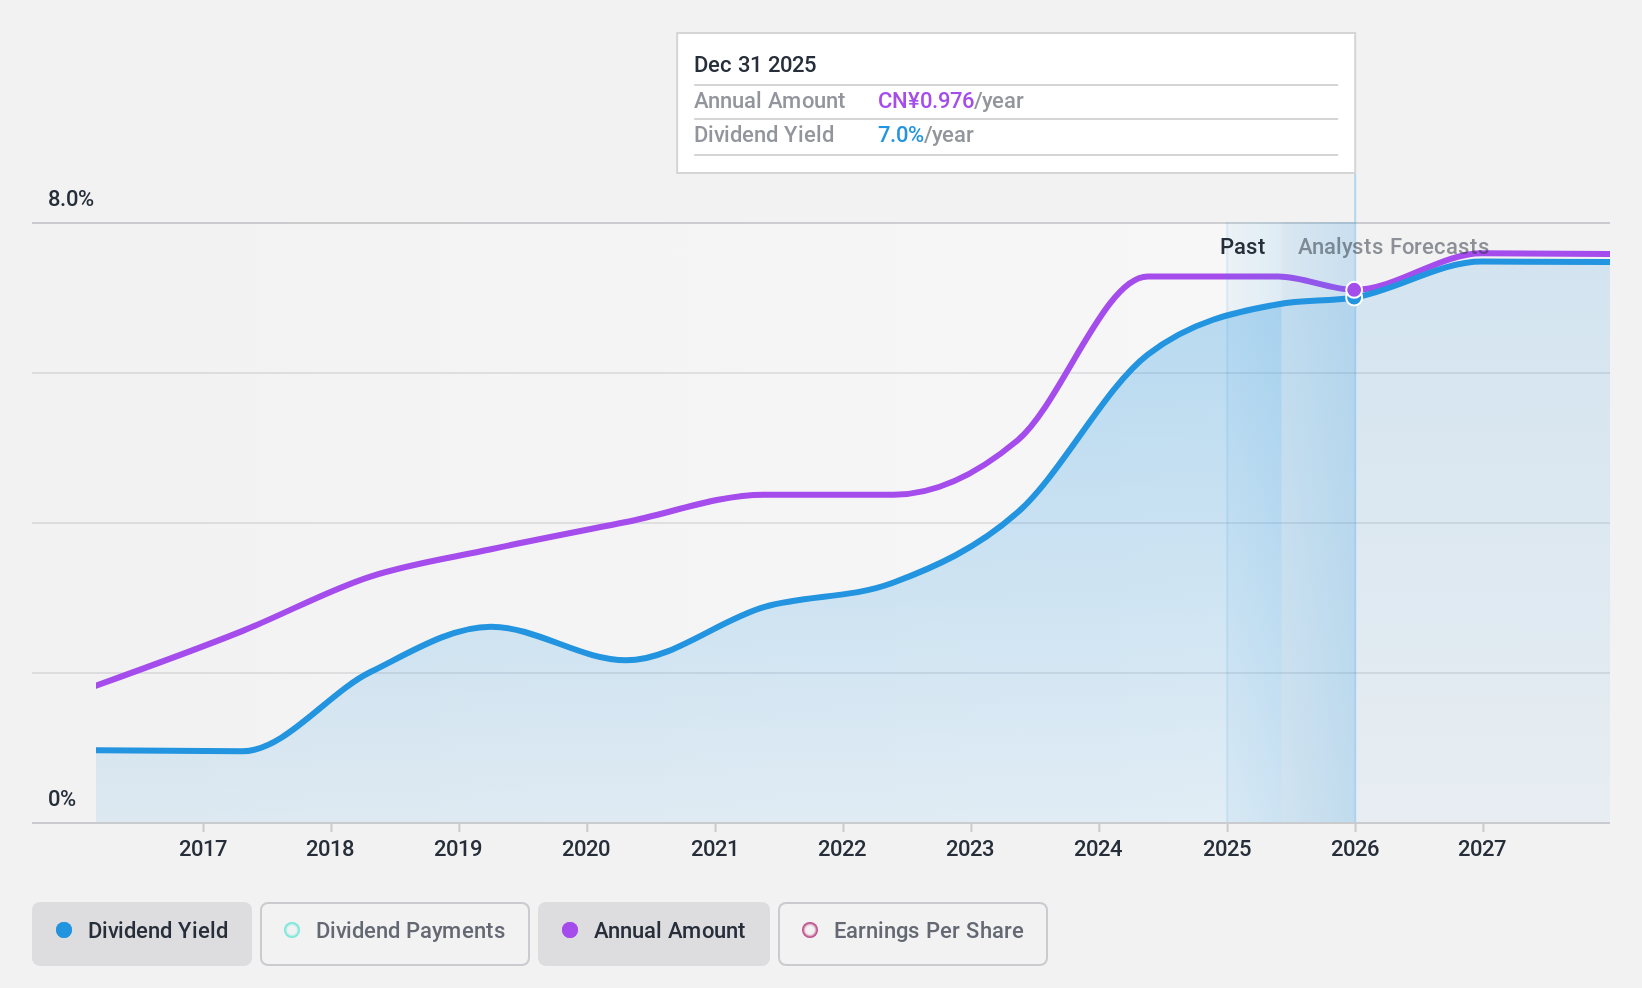
ENN Natural GasLtd (SHSE:600803)
Simply Wall St Dividend Rating: ★★★★★☆
Overview: ENN Natural Gas Co., Ltd. operates in natural gas distribution, trading, storage, transportation, production, and engineering in China with a market cap of CN¥60.51 billion.
Operations: ENN Natural Gas Co., Ltd.'s revenue is primarily derived from its Natural Gas Retail segment at CN¥113.41 billion, followed by Natural Gas Wholesale at CN¥58.68 billion, Pan-energy Business at CN¥32.49 billion, Gas Trading on Platform at CN¥36.04 billion, Smart Home Business at CN¥11.93 billion, Energy Production at CN¥5.44 billion, Infrastructure Operations at CN¥3.61 billion, and Engineering Construction & Installation contributing CN¥9.98 billion in revenue.
Dividend Yield: 5.2%
ENN Natural Gas Ltd. offers a dividend yield in the top 25% of the Chinese market, yet its dividend history has been volatile over the past decade. Despite this, dividends are well-covered by earnings and cash flows with payout ratios around 55%. Recent earnings showed a decline in net income to CNY 4.49 billion from CNY 7.09 billion last year, amid ongoing privatization discussions that could impact its future listing status and shareholder structure.
- Take a closer look at ENN Natural GasLtd's potential here in our dividend report.
- The valuation report we've compiled suggests that ENN Natural GasLtd's current price could be quite moderate.

Suofeiya Home Collection (SZSE:002572)
Simply Wall St Dividend Rating: ★★★★★☆
Overview: Suofeiya Home Collection Co., Ltd. manufactures and sells furniture products in China, with a market cap of CN¥15.19 billion.
Operations: Suofeiya Home Collection Co., Ltd. generates its revenue primarily from the manufacturing and sale of furniture products within China.
Dividend Yield: 6.1%
Suofeiya Home Collection provides a dividend yield of 6.06%, ranking in the top 25% of CN market payers. Its dividends have been reliably stable and growing over the past decade, yet the high cash payout ratio of 1905.7% indicates poor coverage by free cash flows, raising sustainability concerns despite earnings coverage at a 77.2% payout ratio. The stock trades at an attractive valuation, significantly below its estimated fair value, with modest recent earnings growth of 1.4%.
- Click here to discover the nuances of Suofeiya Home Collection with our detailed analytical dividend report.
- Upon reviewing our latest valuation report, Suofeiya Home Collection's share price might be too pessimistic.
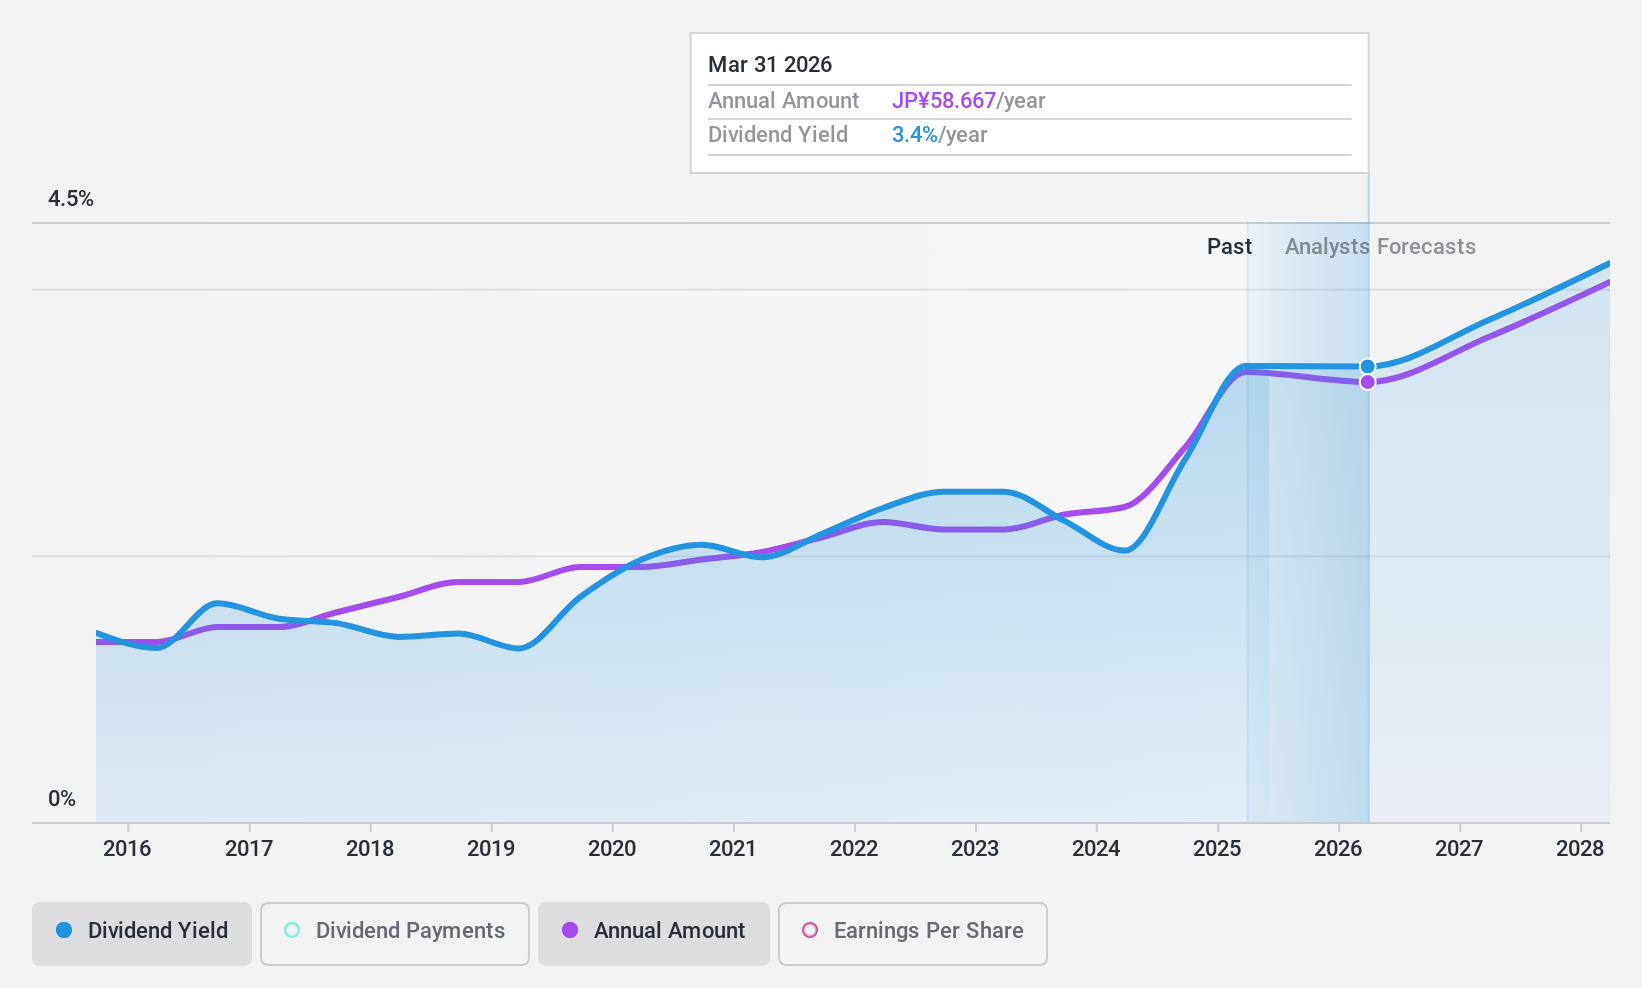
Nisshin Seifun Group (TSE:2002)
Simply Wall St Dividend Rating: ★★★★★☆
Overview: Nisshin Seifun Group Inc. operates in flour milling, processed foods, health foods, biotechnology, engineering, prepared dishes, and mesh cloth sectors both in Japan and internationally with a market cap of approximately ¥501.89 billion.
Operations: Nisshin Seifun Group Inc.'s revenue segments include the Milling Business at ¥470.80 billion, Food Business at ¥206.62 billion, and Prepared Dishes and Other Prepared Foods at ¥158.91 billion.
Dividend Yield: 3.4%
Nisshin Seifun Group's dividend yield of 3.43% is below the top 25% in Japan but remains attractive due to its stability and growth over the past decade. Dividends are well-supported by earnings and cash flows, with payout ratios at 44.5% and 49.1%, respectively. Recent share buybacks, totaling ¥13.91 billion for 2.59% of shares, aim to enhance shareholder returns and capital efficiency, indicating a commitment to maintaining robust dividend policies despite trading significantly below estimated fair value.
- Dive into the specifics of Nisshin Seifun Group here with our thorough dividend report.
- In light of our recent valuation report, it seems possible that Nisshin Seifun Group is trading behind its estimated value.
Turning Ideas Into Actions
- Navigate through the entire inventory of 1580 Top Global Dividend Stocks here.
- Hold shares in these firms? Setup your portfolio in Simply Wall St to seamlessly track your investments and receive personalized updates on your portfolio's performance.
- Take control of your financial future using Simply Wall St, offering free, in-depth knowledge of international markets to every investor.
Looking For Alternative Opportunities?
- Explore high-performing small cap companies that haven't yet garnered significant analyst attention.
- Fuel your portfolio with companies showing strong growth potential, backed by optimistic outlooks both from analysts and management.
- Find companies with promising cash flow potential yet trading below their fair value.
This article by Simply Wall St is general in nature. We provide commentary based on historical data and analyst forecasts only using an unbiased methodology and our articles are not intended to be financial advice. It does not constitute a recommendation to buy or sell any stock, and does not take account of your objectives, or your financial situation. We aim to bring you long-term focused analysis driven by fundamental data. Note that our analysis may not factor in the latest price-sensitive company announcements or qualitative material. Simply Wall St has no position in any stocks mentioned.
Valuation is complex, but we're here to simplify it.
Discover if ENN Natural GasLtd might be undervalued or overvalued with our detailed analysis, featuring fair value estimates, potential risks, dividends, insider trades, and its financial condition.
Access Free AnalysisHave feedback on this article? Concerned about the content? Get in touch with us directly. Alternatively, email editorial-team@simplywallst.com
About SHSE:600803
ENN Natural GasLtd
Engages in natural gas distribution, trading, storage, transportation, production, and engineering in China.
Undervalued with excellent balance sheet and pays a dividend.
Market Insights

Advertisement
Community Narratives
A formidable player in AI and enterprise computing.
Fair Value US$210.00|12.2% overvalued
CO
Community Contributor
IREN's Bold Moves in Sustainable Bitcoin Mining & AI Data Centers
Fair Value US$72.52|17.1% undervalued
BL
Community Contributor
Cooling the Champions: The Aussie Tech Behind F1's Victories
Fair Value AU$12.40|38.7% undervalued
TR
Community Contributor