
Advertisement
- Japan
- /
- Hospitality
- /
- TSE:9722
Risks To Shareholder Returns Are Elevated At These Prices For Fujita Kanko Inc. (TSE:9722)

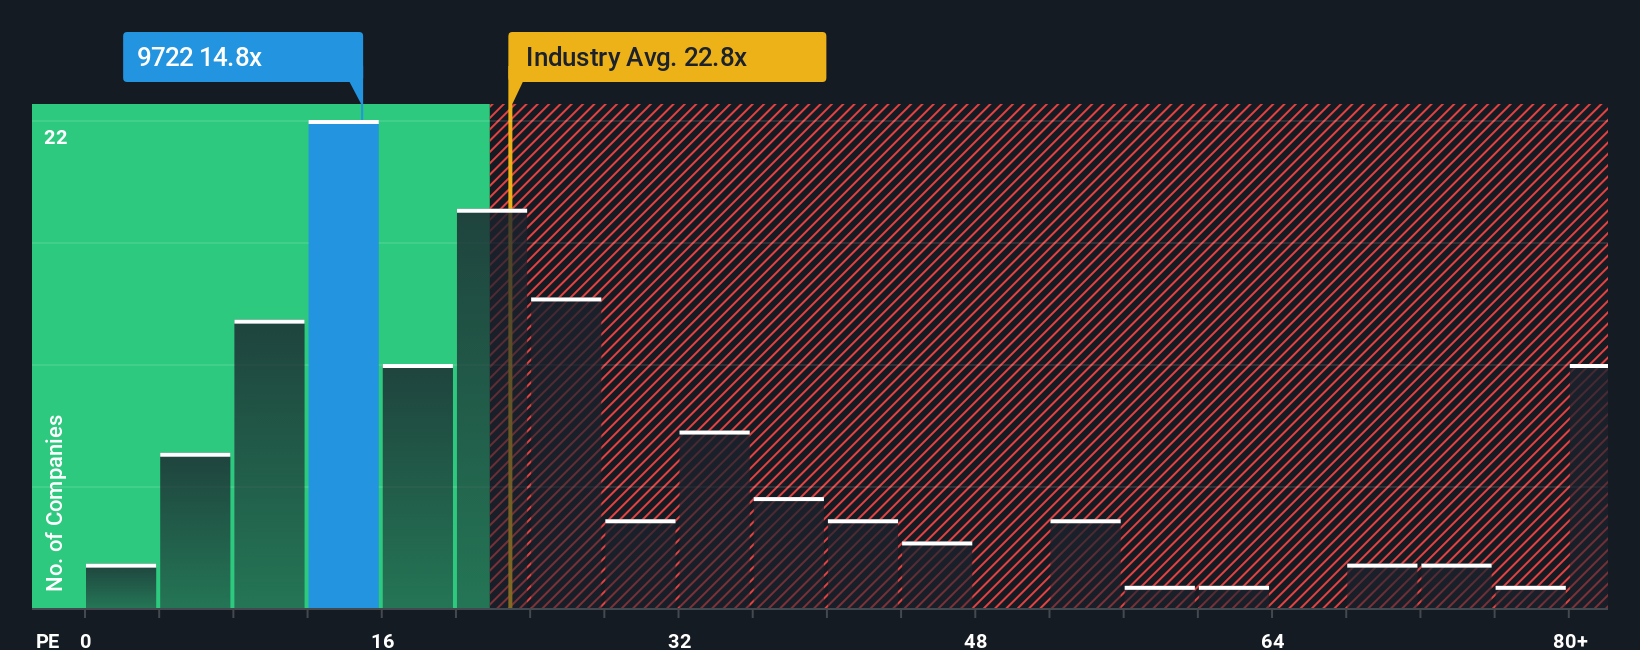
There wouldn't be many who think Fujita Kanko Inc.'s (TSE:9722) price-to-earnings (or "P/E") ratio of 14.8x is worth a mention when the median P/E in Japan is similar at about 14x. While this might not raise any eyebrows, if the P/E ratio is not justified investors could be missing out on a potential opportunity or ignoring looming disappointment.
While the market has experienced earnings growth lately, Fujita Kanko's earnings have gone into reverse gear, which is not great. One possibility is that the P/E is moderate because investors think this poor earnings performance will turn around. If not, then existing shareholders may be a little nervous about the viability of the share price.
View our latest analysis for Fujita Kanko
Is There Some Growth For Fujita Kanko?
Fujita Kanko's P/E ratio would be typical for a company that's only expected to deliver moderate growth, and importantly, perform in line with the market.
Taking a look back first, the company's earnings per share growth last year wasn't something to get excited about as it posted a disappointing decline of 2.0%. At least EPS has managed not to go completely backwards from three years ago in aggregate, thanks to the earlier period of growth. Therefore, it's fair to say that earnings growth has been inconsistent recently for the company.
Looking ahead now, EPS is anticipated to climb by 2.2% per year during the coming three years according to the lone analyst following the company. With the market predicted to deliver 8.9% growth per year, the company is positioned for a weaker earnings result.
In light of this, it's curious that Fujita Kanko's P/E sits in line with the majority of other companies. Apparently many investors in the company are less bearish than analysts indicate and aren't willing to let go of their stock right now. These shareholders may be setting themselves up for future disappointment if the P/E falls to levels more in line with the growth outlook.
The Final Word
We'd say the price-to-earnings ratio's power isn't primarily as a valuation instrument but rather to gauge current investor sentiment and future expectations.
We've established that Fujita Kanko currently trades on a higher than expected P/E since its forecast growth is lower than the wider market. Right now we are uncomfortable with the P/E as the predicted future earnings aren't likely to support a more positive sentiment for long. Unless these conditions improve, it's challenging to accept these prices as being reasonable.
Before you take the next step, you should know about the 1 warning sign for Fujita Kanko that we have uncovered.
You might be able to find a better investment than Fujita Kanko. If you want a selection of possible candidates, check out this free list of interesting companies that trade on a low P/E (but have proven they can grow earnings).
New: AI Stock Screener & Alerts
Our new AI Stock Screener scans the market every day to uncover opportunities.
• Dividend Powerhouses (3%+ Yield)
• Undervalued Small Caps with Insider Buying
• High growth Tech and AI Companies
Or build your own from over 50 metrics.
Have feedback on this article? Concerned about the content? Get in touch with us directly. Alternatively, email editorial-team (at) simplywallst.com.
This article by Simply Wall St is general in nature. We provide commentary based on historical data and analyst forecasts only using an unbiased methodology and our articles are not intended to be financial advice. It does not constitute a recommendation to buy or sell any stock, and does not take account of your objectives, or your financial situation. We aim to bring you long-term focused analysis driven by fundamental data. Note that our analysis may not factor in the latest price-sensitive company announcements or qualitative material. Simply Wall St has no position in any stocks mentioned.
About TSE:9722
Fair value with mediocre balance sheet.
Market Insights

Advertisement
Community Narratives
Pole position to benefit from GENIUS Act
Fair Value US$233.04|59.1% undervalued
CH
Community Contributor
IREN will transform from bitcoin miner to leader in AI infrastructure
Fair Value US$21.48|15.5% undervalued
KA
Community Contributor
Behind the Assay: XRF Scientific’s Role in Modern Mining Economics
Fair Value AU$2.10|0% overvalued
RO
Community Contributor