
Advertisement
- Japan
- /
- Food and Staples Retail
- /
- TSE:3141
Welcia Holdings Co., Ltd.'s (TSE:3141) Financials Are Too Obscure To Link With Current Share Price Momentum: What's In Store For the Stock?

Welcia Holdings' (TSE:3141) stock is up by a considerable 16% over the past three months. But the company's key financial indicators appear to be differing across the board and that makes us question whether or not the company's current share price momentum can be maintained. Specifically, we decided to study Welcia Holdings' ROE in this article.
Return on Equity or ROE is a test of how effectively a company is growing its value and managing investors’ money. Simply put, it is used to assess the profitability of a company in relation to its equity capital.
See our latest analysis for Welcia Holdings
How To Calculate Return On Equity?
The formula for ROE is:
Return on Equity = Net Profit (from continuing operations) ÷ Shareholders' Equity
So, based on the above formula, the ROE for Welcia Holdings is:
8.0% = JP¥20b ÷ JP¥254b (Based on the trailing twelve months to November 2024).
The 'return' is the income the business earned over the last year. One way to conceptualize this is that for each ¥1 of shareholders' capital it has, the company made ¥0.08 in profit.
What Has ROE Got To Do With Earnings Growth?
We have already established that ROE serves as an efficient profit-generating gauge for a company's future earnings. We now need to evaluate how much profit the company reinvests or "retains" for future growth which then gives us an idea about the growth potential of the company. Assuming all else is equal, companies that have both a higher return on equity and higher profit retention are usually the ones that have a higher growth rate when compared to companies that don't have the same features.
A Side By Side comparison of Welcia Holdings' Earnings Growth And 8.0% ROE
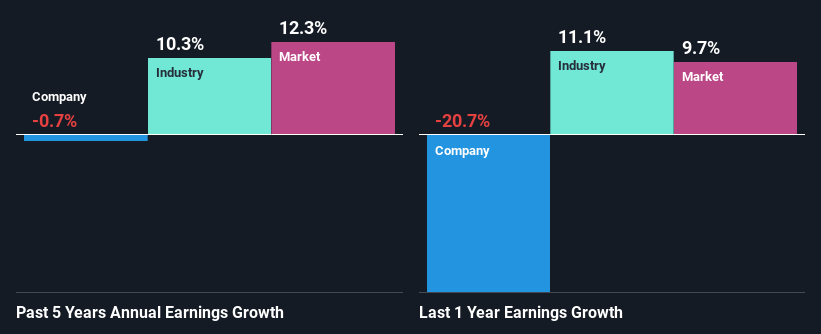
On the face of it, Welcia Holdings' ROE is not much to talk about. However, given that the company's ROE is similar to the average industry ROE of 9.3%, we may spare it some thought. Having said that, Welcia Holdings' net income growth over the past five years is more or less flat. Remember, the company's ROE is not particularly great to begin with. Hence, this provides some context to the flat earnings growth seen by the company.
As a next step, we compared Welcia Holdings' net income growth with the industry and discovered that the industry saw an average growth of 10% in the same period.
Earnings growth is a huge factor in stock valuation. It’s important for an investor to know whether the market has priced in the company's expected earnings growth (or decline). Doing so will help them establish if the stock's future looks promising or ominous. Has the market priced in the future outlook for 3141? You can find out in our latest intrinsic value infographic research report.
Is Welcia Holdings Efficiently Re-investing Its Profits?
Welcia Holdings has a low three-year median payout ratio of 24% (or a retention ratio of 76%) but the negligible earnings growth number doesn't reflect this as high growth usually follows high profit retention.
Moreover, Welcia Holdings has been paying dividends for at least ten years or more suggesting that management must have perceived that the shareholders prefer dividends over earnings growth.
Summary
On the whole, we feel that the performance shown by Welcia Holdings can be open to many interpretations. While the company does have a high rate of profit retention, its low rate of return is probably hampering its earnings growth. With that said, we studied the latest analyst forecasts and found that while the company has shrunk its earnings in the past, analysts expect its earnings to grow in the future. Are these analysts expectations based on the broad expectations for the industry, or on the company's fundamentals? Click here to be taken to our analyst's forecasts page for the company.
Valuation is complex, but we're here to simplify it.
Discover if Welcia Holdings might be undervalued or overvalued with our detailed analysis, featuring fair value estimates, potential risks, dividends, insider trades, and its financial condition.
Access Free AnalysisHave feedback on this article? Concerned about the content? Get in touch with us directly. Alternatively, email editorial-team (at) simplywallst.com.
This article by Simply Wall St is general in nature. We provide commentary based on historical data and analyst forecasts only using an unbiased methodology and our articles are not intended to be financial advice. It does not constitute a recommendation to buy or sell any stock, and does not take account of your objectives, or your financial situation. We aim to bring you long-term focused analysis driven by fundamental data. Note that our analysis may not factor in the latest price-sensitive company announcements or qualitative material. Simply Wall St has no position in any stocks mentioned.
About TSE:3141
Welcia Holdings
Operates a chain of drug stores with dispensing pharmacies in Japan.
Excellent balance sheet average dividend payer.
Similar Companies
Market Insights

Advertisement
Community Narratives
Pinterest will surge as advertising innovations ignite revenue growth
Fair Value US$42.63|26.3% undervalued
BR
Community Contributor
Brambles' Revenue Set to Climb 14% with Profit Margins Following
Fair Value AU$21.90|4.8% overvalued
RO
Community Contributor
Challenging Future for STG as Organic Sales Decline by 8.8%
Fair Value DKK 116.13|26.8% undervalued
KA
Community Contributor