Sharp (TSE:6753) shares have shown a modest recovery over the past month, climbing about 1% after several weeks of muted trading. Investors have taken note, weighing recent performance against longer-term returns and the company's latest financial disclosures.
While Sharp's shares have bounced back modestly in the last month, the bigger story is how momentum has shifted over the past quarter. The 31.1% 90-day share price return suggests renewed optimism, even though the 1-year total shareholder return remains negative. This hints that sentiment around recovery is only just starting to build.
The question for investors now is whether Sharp's recent gains signal an undervalued opportunity, or if the company's future growth is already fully reflected in today's share price and recent rally.
Advertisement
Price-to-Earnings of 8.7x: Is it justified?
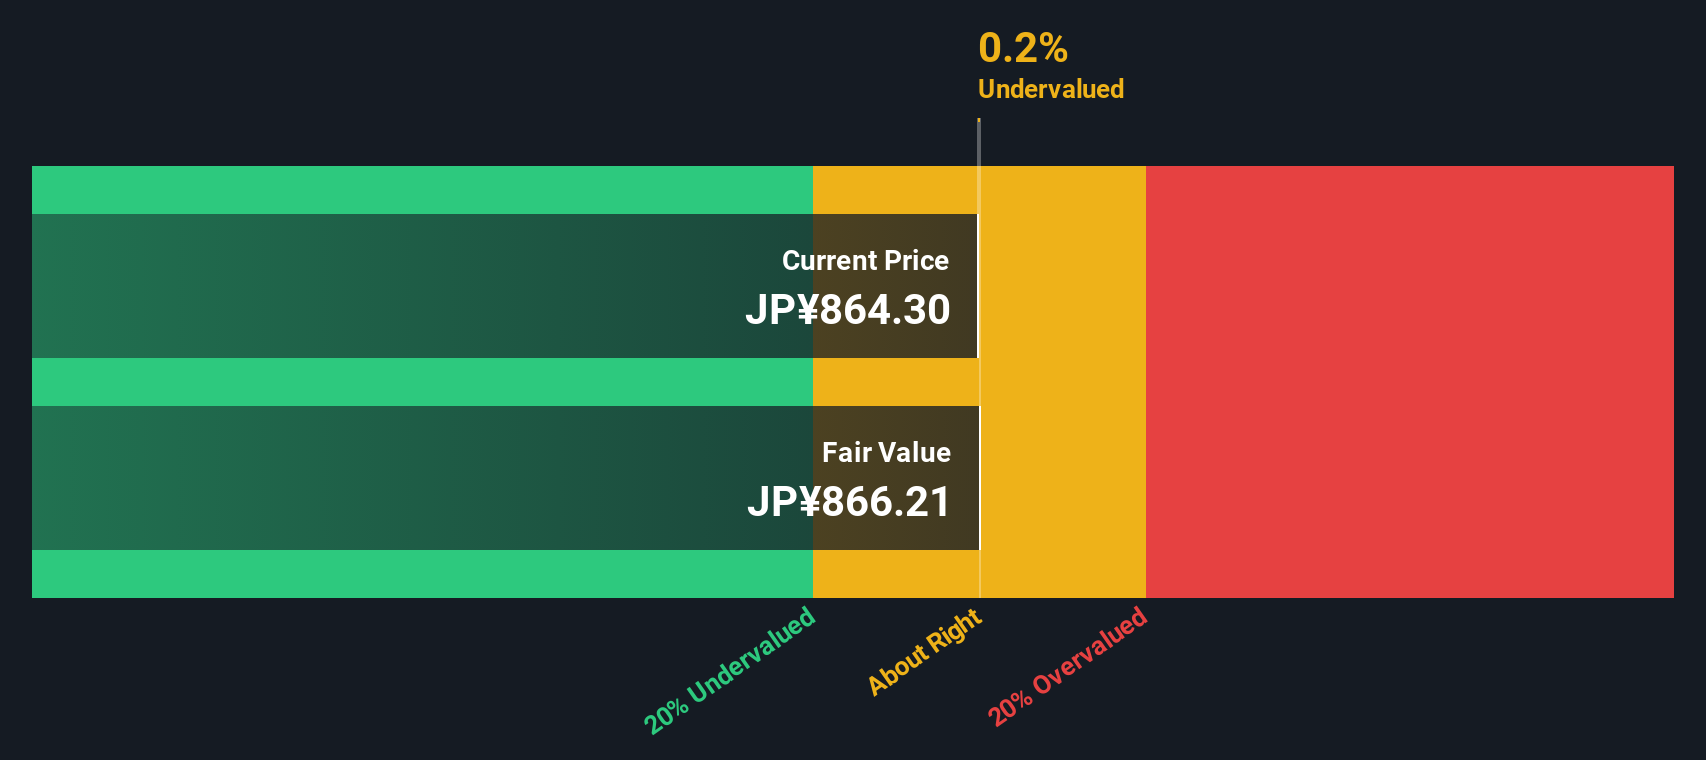
Sharp’s shares are currently trading at a price-to-earnings (P/E) ratio of 8.7x, which positions the stock as attractively valued relative to its industry peers and fair value benchmarks, given the latest close of ¥864.3.
The P/E ratio measures how much investors are willing to pay today for a company's earnings. In consumer durables, a lower P/E often signals skepticism over sustained profitability or growth. Sharp's relatively low P/E may reflect market doubts about its ability to maintain recent profits.
Compared to both the industry average (11.7x) and peer average (29.6x), Sharp’s P/E stands out as a notable discount. Our analysis also points out that this is well below the estimated fair P/E of 11.6x. This shows room for potential upward re-rating if the company can deliver consistent performance.
However, lingering concerns about declining annual revenue and double-digit drops in net income growth could challenge any sustained recovery for Sharp shares.
Another View: SWS DCF Model Suggests a Similar Story
Looking at Sharp through the lens of our SWS DCF model, the stock appears to be trading just below its estimated fair value, with only a marginal 0.2% discount. This supports the idea that Sharp is near its intrinsic worth right now, even after its recent rally. Does this narrow gap point to limited upside, or is the market too cautious in its pricing?
Simply Wall St performs a discounted cash flow (DCF) on every stock in the world every day (check out Sharp for example). We show the entire calculation in full. You can track the result in your watchlist or portfolio and be alerted when this changes, or use our stock screener to discover undervalued stocks based on their cash flows. If you save a screener we even alert you when new companies match - so you never miss a potential opportunity.
Build Your Own Sharp Narrative
If you see the numbers differently or want to dig into the details yourself, it's quick and easy to craft your own perspective in just a few minutes, so go ahead and Do it your way.
Unlock more potential by acting now. Smart investors like you stay ahead by seeking out tomorrow's winners before the crowd rushes in.
Tap into generous yields when you check out these 19 dividend stocks with yields > 3%, which are paying over 3% and can give your portfolio the income edge it deserves.
Accelerate your search for tech-forward growth by targeting these 24 AI penny stocks, positioned at the forefront of artificial intelligence innovation.
This article by Simply Wall St is general in nature. We provide commentary based on historical data
and analyst forecasts only using an unbiased methodology and our articles are not intended to be financial advice. It does not constitute a recommendation to buy or sell any stock, and does not take account of your objectives, or your
financial situation. We aim to bring you long-term focused analysis driven by fundamental data.
Note that our analysis may not factor in the latest price-sensitive company announcements or qualitative material.
Simply Wall St has no position in any stocks mentioned.
New: Manage All Your Stock Portfolios in One Place
We've created the ultimate portfolio companion for stock investors, and it's free.
• Connect an unlimited number of Portfolios and see your total in one currency • Be alerted to new Warning Signs or Risks via email or mobile • Track the Fair Value of your stocks
Manufactures and sells telecommunication equipment, electric and electronic application equipment, and electronic components in Japan, China, and internationally.