
Advertisement
- Japan
- /
- Commercial Services
- /
- TSE:9755
OYO Corporation's (TSE:9755) 30% Jump Shows Its Popularity With Investors

OYO Corporation (TSE:9755) shareholders have had their patience rewarded with a 30% share price jump in the last month. The last 30 days bring the annual gain to a very sharp 36%.
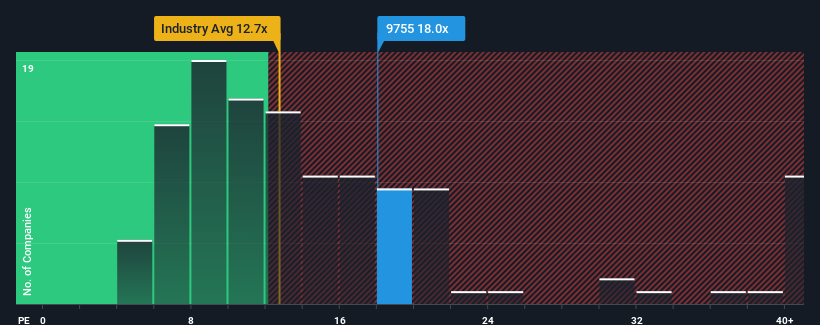
Following the firm bounce in price, OYO's price-to-earnings (or "P/E") ratio of 18x might make it look like a sell right now compared to the market in Japan, where around half of the companies have P/E ratios below 13x and even P/E's below 9x are quite common. Although, it's not wise to just take the P/E at face value as there may be an explanation why it's as high as it is.
It looks like earnings growth has deserted OYO recently, which is not something to boast about. One possibility is that the P/E is high because investors think the benign earnings growth will improve to outperform the broader market in the near future. If not, then existing shareholders may be a little nervous about the viability of the share price.
Check out our latest analysis for OYO
How Is OYO's Growth Trending?
The only time you'd be truly comfortable seeing a P/E as high as OYO's is when the company's growth is on track to outshine the market.
Taking a look back first, we see that there was hardly any earnings per share growth to speak of for the company over the past year. However, a few strong years before that means that it was still able to grow EPS by an impressive 52% in total over the last three years. So we can start by confirming that the company has done a great job of growing earnings over that time.
This is in contrast to the rest of the market, which is expected to grow by 11% over the next year, materially lower than the company's recent medium-term annualised growth rates.
With this information, we can see why OYO is trading at such a high P/E compared to the market. It seems most investors are expecting this strong growth to continue and are willing to pay more for the stock.
The Final Word
OYO shares have received a push in the right direction, but its P/E is elevated too. Using the price-to-earnings ratio alone to determine if you should sell your stock isn't sensible, however it can be a practical guide to the company's future prospects.
As we suspected, our examination of OYO revealed its three-year earnings trends are contributing to its high P/E, given they look better than current market expectations. At this stage investors feel the potential for a deterioration in earnings isn't great enough to justify a lower P/E ratio. Unless the recent medium-term conditions change, they will continue to provide strong support to the share price.
There are also other vital risk factors to consider before investing and we've discovered 1 warning sign for OYO that you should be aware of.
If these risks are making you reconsider your opinion on OYO, explore our interactive list of high quality stocks to get an idea of what else is out there.
New: AI Stock Screener & Alerts
Our new AI Stock Screener scans the market every day to uncover opportunities.
• Dividend Powerhouses (3%+ Yield)
• Undervalued Small Caps with Insider Buying
• High growth Tech and AI Companies
Or build your own from over 50 metrics.
Have feedback on this article? Concerned about the content? Get in touch with us directly. Alternatively, email editorial-team (at) simplywallst.com.
This article by Simply Wall St is general in nature. We provide commentary based on historical data and analyst forecasts only using an unbiased methodology and our articles are not intended to be financial advice. It does not constitute a recommendation to buy or sell any stock, and does not take account of your objectives, or your financial situation. We aim to bring you long-term focused analysis driven by fundamental data. Note that our analysis may not factor in the latest price-sensitive company announcements or qualitative material. Simply Wall St has no position in any stocks mentioned.
About TSE:9755
Adequate balance sheet second-rate dividend payer.
Similar Companies
Market Insights

Advertisement
Community Narratives
Pinterest will surge as advertising innovations ignite revenue growth
Fair Value US$42.63|27.1% undervalued
BR
Community Contributor
Brambles' Revenue Set to Climb 14% with Profit Margins Following
Fair Value AU$21.90|4.9% overvalued
RO
Community Contributor
Challenging Future for STG as Organic Sales Decline by 8.8%
Fair Value DKK 116.13|26.8% undervalued
KA
Community Contributor