Advertisement
- Taiwan
- /
- Renewable Energy
- /
- TWSE:6873
3 Asian Stocks Estimated To Be Trading At Up To 28.4% Below Intrinsic Value

Simply Wall St
Reviewed by Simply Wall St
As global markets grapple with renewed U.S.-China trade tensions and geopolitical uncertainties, Asian stock markets have shown mixed performances, with Japan experiencing a notable rise due to political developments while China's consumption data during its Golden Week suggested a more cautious economic outlook. In such an environment, identifying undervalued stocks becomes crucial for investors seeking opportunities amidst volatility; these stocks are often characterized by their potential to outperform based on intrinsic value assessments that may not yet be fully recognized by the market.
Top 10 Undervalued Stocks Based On Cash Flows In Asia
| Name | Current Price | Fair Value (Est) | Discount (Est) |
| Zhejiang Century Huatong GroupLtd (SZSE:002602) | CN¥19.54 | CN¥38.19 | 48.8% |
| Taiwan Union Technology (TPEX:6274) | NT$309.50 | NT$612.24 | 49.4% |
| Sheng Siong Group (SGX:OV8) | SGD2.15 | SGD4.28 | 49.8% |
| Insource (TSE:6200) | ¥914.00 | ¥1802.69 | 49.3% |
| Guangdong Lyric Robot AutomationLtd (SHSE:688499) | CN¥60.25 | CN¥120.03 | 49.8% |
| DuChemBIOLtd (KOSDAQ:A176750) | ₩9150.00 | ₩17988.70 | 49.1% |
| Com2uS (KOSDAQ:A078340) | ₩34900.00 | ₩68927.45 | 49.4% |
| Chifeng Jilong Gold MiningLtd (SHSE:600988) | CN¥30.58 | CN¥60.78 | 49.7% |
| Bloomberry Resorts (PSE:BLOOM) | ₱3.84 | ₱7.66 | 49.9% |
| Beijing LongRuan Technologies (SHSE:688078) | CN¥30.04 | CN¥59.63 | 49.6% |
Here we highlight a subset of our preferred stocks from the screener.
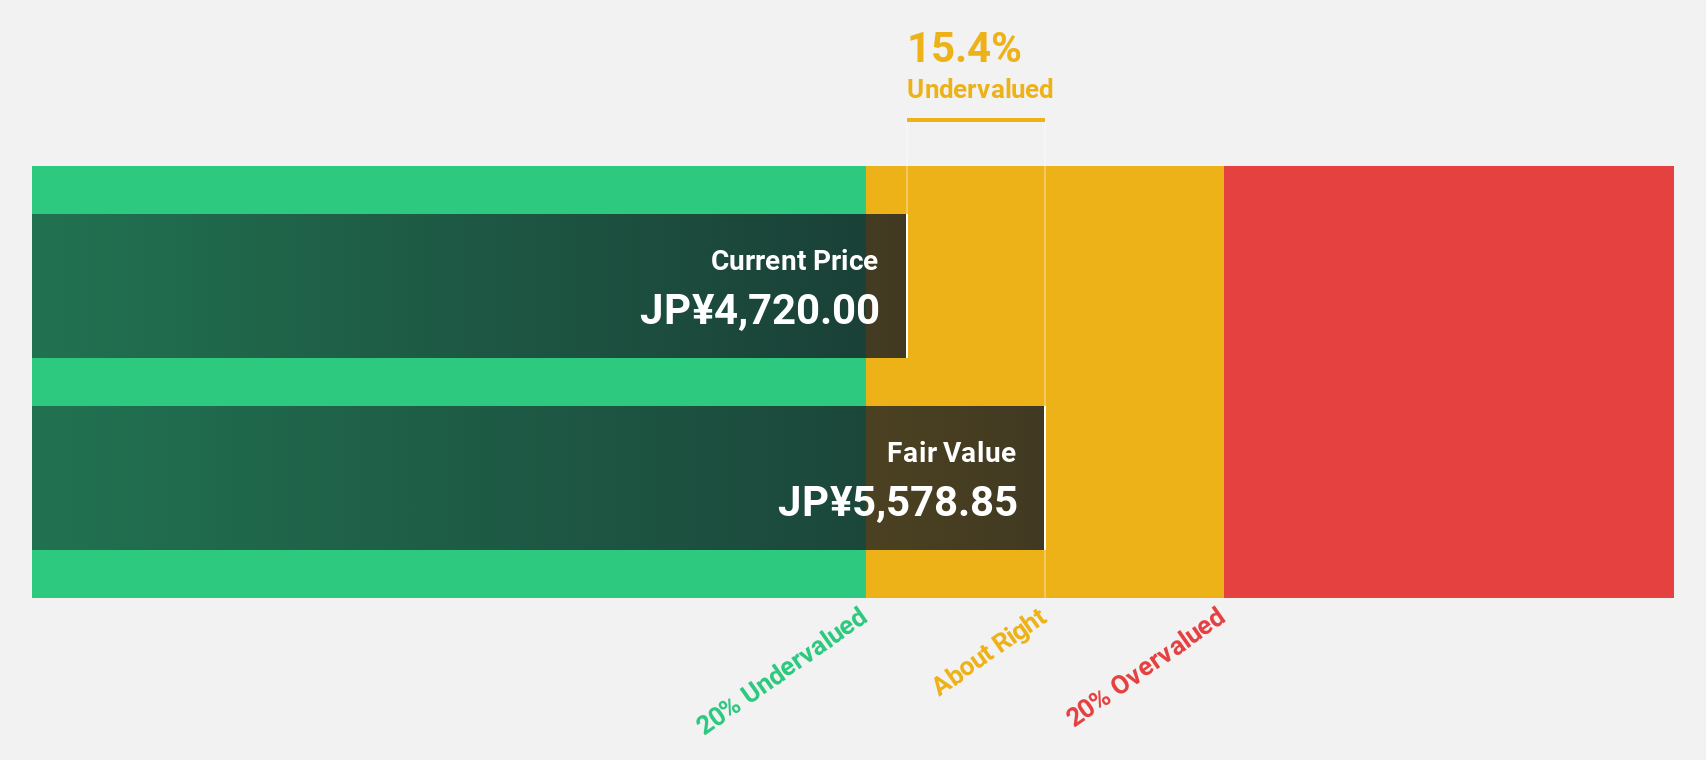
TORIDOLL Holdings (TSE:3397)
Overview: TORIDOLL Holdings Corporation operates and manages restaurants in Japan and internationally, with a market cap of ¥418.35 billion.
Operations: The company's revenue segments include Marugame Seimen generating ¥131.67 billion and Overseas Business contributing ¥103.21 billion.
Estimated Discount To Fair Value: 14.9%
TORIDOLL Holdings is trading at ¥4,767, below its estimated fair value of ¥5,601.86, suggesting it may be undervalued based on cash flows. Earnings are expected to grow significantly at 30.3% annually over the next three years, outpacing the Japanese market's growth rate of 8.1%. However, revenue growth is forecasted at a modest 7.1% per year. Recent guidance anticipates revenue of ¥282 billion and profit for the year of ¥6.1 billion by March 2026.
- Upon reviewing our latest growth report, TORIDOLL Holdings' projected financial performance appears quite optimistic.
- Dive into the specifics of TORIDOLL Holdings here with our thorough financial health report.
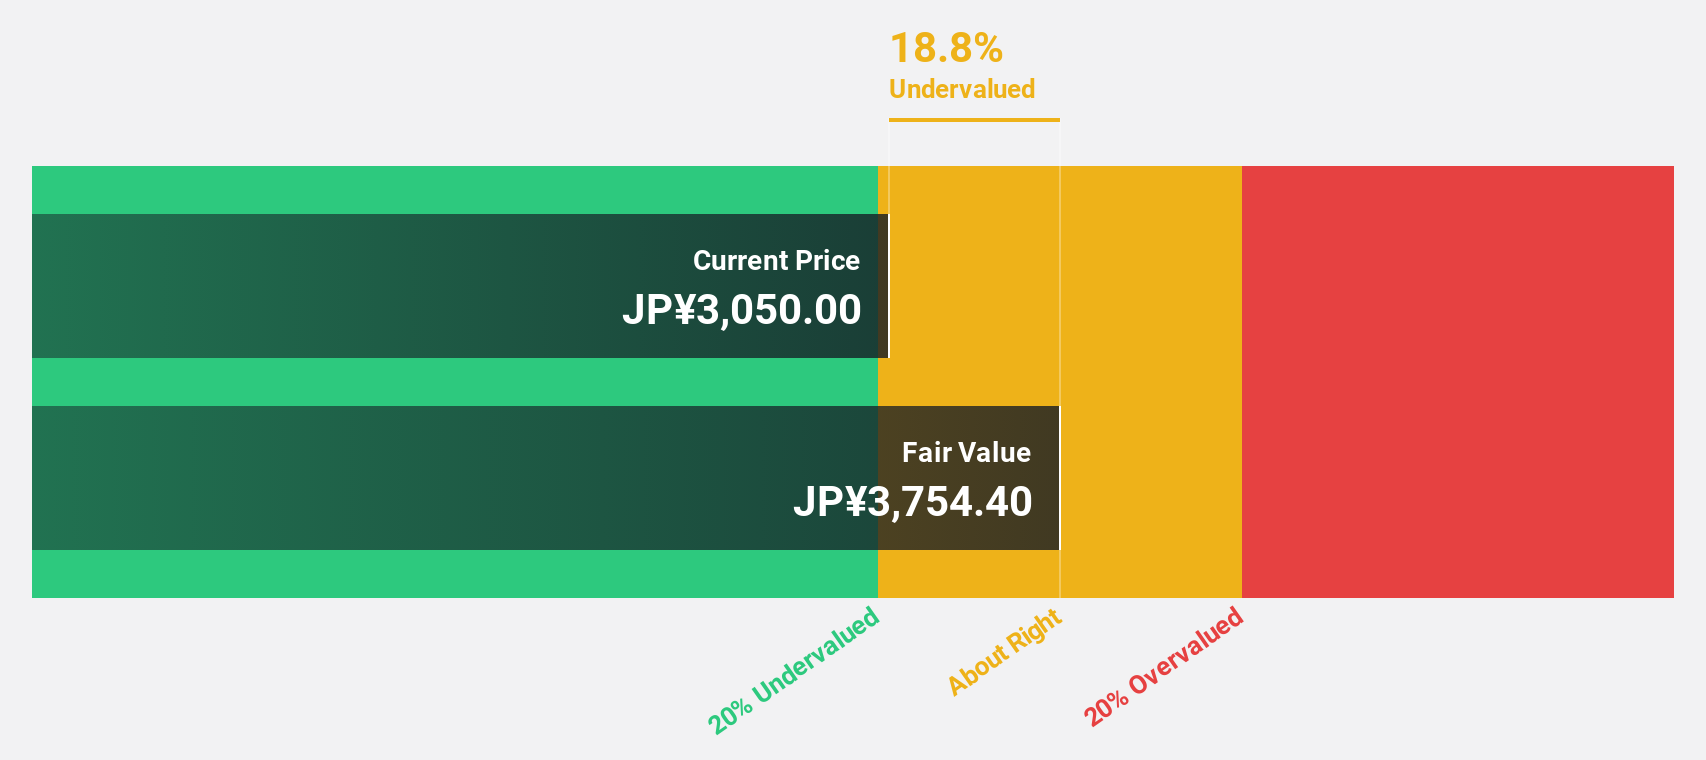
Aidma Holdings (TSE:7373)
Overview: Aidma Holdings, Inc. operates in sales, business, and management support services both in Japan and internationally, with a market cap of ¥46 billion.
Operations: Aidma Holdings generates revenue through its sales, business, and management support services in both domestic and international markets.
Estimated Discount To Fair Value: 27.4%
Aidma Holdings is trading at ¥3,095, below its fair value estimate of ¥4,260.63, highlighting its potential undervaluation based on cash flows. The company forecasts robust revenue growth at 20.2% annually, surpassing the Japanese market's 4.5%. Earnings are projected to grow at 16.6% per year, outpacing the market's 8.1%. Despite recent share price volatility and a completed buyback of 250,000 shares for ¥652.14 million, Aidma remains financially promising with high future return on equity expectations.
- The analysis detailed in our Aidma Holdings growth report hints at robust future financial performance.
- Unlock comprehensive insights into our analysis of Aidma Holdings stock in this financial health report.
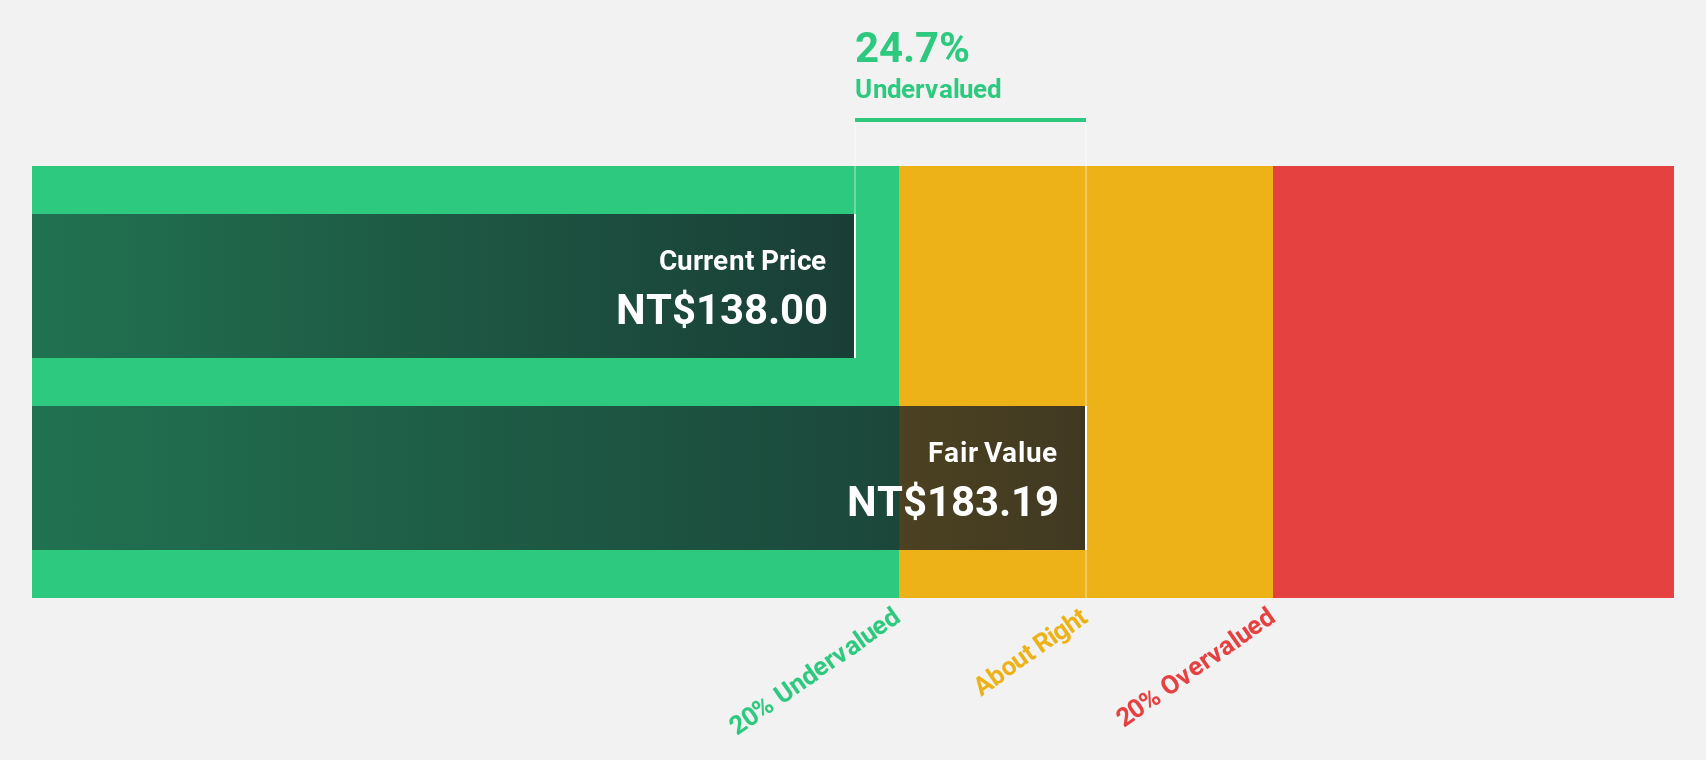
HD Renewable Energy (TWSE:6873)
Overview: HD Renewable Energy Co., Ltd. focuses on the development, engineering construction, and maintenance of solar power generation systems in Taiwan, with a market cap of NT$17.91 billion.
Operations: The company's revenue primarily comes from its heavy construction segment, amounting to NT$11.33 billion.
Estimated Discount To Fair Value: 28.4%
HD Renewable Energy is trading at NT$128, below its fair value estimate of NT$178.66, suggesting undervaluation based on cash flows. The company forecasts significant earnings growth of 43.45% annually, surpassing the Taiwan market's 18.2%. Despite a decrease in net income for Q2 2025 compared to last year, sales increased markedly to TWD 1.89 billion from TWD 1.27 billion, highlighting strong revenue growth potential amidst good relative value compared to peers and industry standards.
- Our earnings growth report unveils the potential for significant increases in HD Renewable Energy's future results.
- Take a closer look at HD Renewable Energy's balance sheet health here in our report.
Where To Now?
- Get an in-depth perspective on all 279 Undervalued Asian Stocks Based On Cash Flows by using our screener here.
- Have you diversified into these companies? Leverage the power of Simply Wall St's portfolio to keep a close eye on market movements affecting your investments.
- Invest smarter with the free Simply Wall St app providing detailed insights into every stock market around the globe.
Interested In Other Possibilities?
- Explore high-performing small cap companies that haven't yet garnered significant analyst attention.
- Diversify your portfolio with solid dividend payers offering reliable income streams to weather potential market turbulence.
- Fuel your portfolio with companies showing strong growth potential, backed by optimistic outlooks both from analysts and management.
This article by Simply Wall St is general in nature. We provide commentary based on historical data and analyst forecasts only using an unbiased methodology and our articles are not intended to be financial advice. It does not constitute a recommendation to buy or sell any stock, and does not take account of your objectives, or your financial situation. We aim to bring you long-term focused analysis driven by fundamental data. Note that our analysis may not factor in the latest price-sensitive company announcements or qualitative material. Simply Wall St has no position in any stocks mentioned.
Valuation is complex, but we're here to simplify it.
Discover if HD Renewable Energy might be undervalued or overvalued with our detailed analysis, featuring fair value estimates, potential risks, dividends, insider trades, and its financial condition.
Access Free AnalysisHave feedback on this article? Concerned about the content? Get in touch with us directly. Alternatively, email editorial-team@simplywallst.com
About TWSE:6873
HD Renewable Energy
Engages in the development of solar power generation systems, engineering construction, and maintenances in Taiwan.
Very undervalued with high growth potential.
Market Insights

Advertisement
Community Narratives
A formidable player in AI and enterprise computing.
Fair Value US$210.00|3.9% overvalued
CO
Community Contributor
IREN's Bold Moves in Sustainable Bitcoin Mining & AI Data Centers
Fair Value US$72.52|4.1% undervalued
BL
Community Contributor
Cooling the Champions: The Aussie Tech Behind F1's Victories
Fair Value AU$12.40|39.4% undervalued
TR
Community Contributor