- Japan
- /
- Electrical
- /
- TSE:6594
Nidec Corporation's (TSE:6594) Stock On An Uptrend: Could Fundamentals Be Driving The Momentum?


Nidec (TSE:6594) has had a great run on the share market with its stock up by a significant 21% over the last month. As most would know, fundamentals are what usually guide market price movements over the long-term, so we decided to look at the company's key financial indicators today to determine if they have any role to play in the recent price movement. Specifically, we decided to study Nidec's ROE in this article.
Return on Equity or ROE is a test of how effectively a company is growing its value and managing investors’ money. Put another way, it reveals the company's success at turning shareholder investments into profits.
How To Calculate Return On Equity?
Return on equity can be calculated by using the formula:
Return on Equity = Net Profit (from continuing operations) ÷ Shareholders' Equity
So, based on the above formula, the ROE for Nidec is:
9.4% = JP¥164b ÷ JP¥1.7t (Based on the trailing twelve months to March 2025).
The 'return' is the yearly profit. One way to conceptualize this is that for each ¥1 of shareholders' capital it has, the company made ¥0.09 in profit.
View our latest analysis for Nidec
What Is The Relationship Between ROE And Earnings Growth?
We have already established that ROE serves as an efficient profit-generating gauge for a company's future earnings. Based on how much of its profits the company chooses to reinvest or "retain", we are then able to evaluate a company's future ability to generate profits. Assuming all else is equal, companies that have both a higher return on equity and higher profit retention are usually the ones that have a higher growth rate when compared to companies that don't have the same features.
A Side By Side comparison of Nidec's Earnings Growth And 9.4% ROE
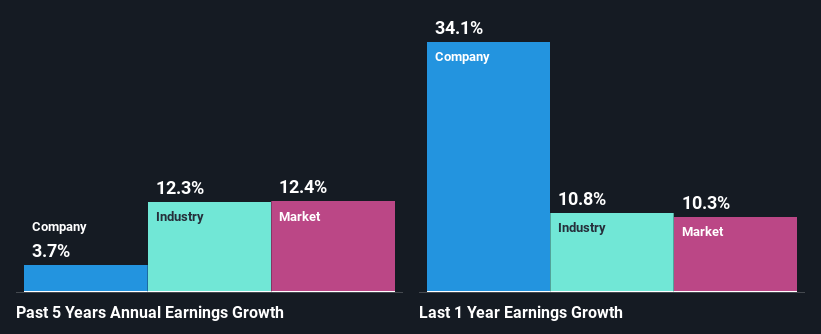
To begin with, Nidec seems to have a respectable ROE. Further, the company's ROE is similar to the industry average of 7.9%. Despite the moderate return on equity, Nidec has posted a net income growth of 3.7% over the past five years. A few likely reasons that could be keeping earnings growth low are - the company has a high payout ratio or the business has allocated capital poorly, for instance.
Next, on comparing with the industry net income growth, we found that Nidec's reported growth was lower than the industry growth of 12% over the last few years, which is not something we like to see.
The basis for attaching value to a company is, to a great extent, tied to its earnings growth. What investors need to determine next is if the expected earnings growth, or the lack of it, is already built into the share price. Doing so will help them establish if the stock's future looks promising or ominous. Has the market priced in the future outlook for 6594? You can find out in our latest intrinsic value infographic research report.
Is Nidec Using Its Retained Earnings Effectively?
While Nidec has a decent three-year median payout ratio of 37% (or a retention ratio of 63%), it has seen very little growth in earnings. So there might be other factors at play here which could potentially be hampering growth. For example, the business has faced some headwinds.
In addition, Nidec has been paying dividends over a period of at least ten years suggesting that keeping up dividend payments is way more important to the management even if it comes at the cost of business growth.
Summary
In total, it does look like Nidec has some positive aspects to its business. However, given the high ROE and high profit retention, we would expect the company to be delivering strong earnings growth, but that isn't the case here. This suggests that there might be some external threat to the business, that's hampering its growth. Having said that, looking at the current analyst estimates, we found that the company's earnings are expected to gain momentum. To know more about the company's future earnings growth forecasts take a look at this free report on analyst forecasts for the company to find out more.
If you're looking to trade Nidec, open an account with the lowest-cost platform trusted by professionals, Interactive Brokers.
With clients in over 200 countries and territories, and access to 160 markets, IBKR lets you trade stocks, options, futures, forex, bonds and funds from a single integrated account.
Enjoy no hidden fees, no account minimums, and FX conversion rates as low as 0.03%, far better than what most brokers offer.
Sponsored ContentValuation is complex, but we're here to simplify it.
Discover if Nidec might be undervalued or overvalued with our detailed analysis, featuring fair value estimates, potential risks, dividends, insider trades, and its financial condition.
Access Free AnalysisHave feedback on this article? Concerned about the content? Get in touch with us directly. Alternatively, email editorial-team (at) simplywallst.com.
This article by Simply Wall St is general in nature. We provide commentary based on historical data and analyst forecasts only using an unbiased methodology and our articles are not intended to be financial advice. It does not constitute a recommendation to buy or sell any stock, and does not take account of your objectives, or your financial situation. We aim to bring you long-term focused analysis driven by fundamental data. Note that our analysis may not factor in the latest price-sensitive company announcements or qualitative material. Simply Wall St has no position in any stocks mentioned.
About TSE:6594
Nidec
Develops, manufactures, and sells motors, electronics and optical components, and other related products in Japan and internationally.
Flawless balance sheet with solid track record and pays a dividend.
Similar Companies
Market Insights

Community Narratives


