

Legendary fund manager Li Lu (who Charlie Munger backed) once said, 'The biggest investment risk is not the volatility of prices, but whether you will suffer a permanent loss of capital.' It's only natural to consider a company's balance sheet when you examine how risky it is, since debt is often involved when a business collapses. We note that Makita Corporation (TSE:6586) does have debt on its balance sheet. But should shareholders be worried about its use of debt?
What Risk Does Debt Bring?
Debt and other liabilities become risky for a business when it cannot easily fulfill those obligations, either with free cash flow or by raising capital at an attractive price. Ultimately, if the company can't fulfill its legal obligations to repay debt, shareholders could walk away with nothing. However, a more usual (but still expensive) situation is where a company must dilute shareholders at a cheap share price simply to get debt under control. Of course, debt can be an important tool in businesses, particularly capital heavy businesses. When we examine debt levels, we first consider both cash and debt levels, together.
Check out our latest analysis for Makita
What Is Makita's Net Debt?
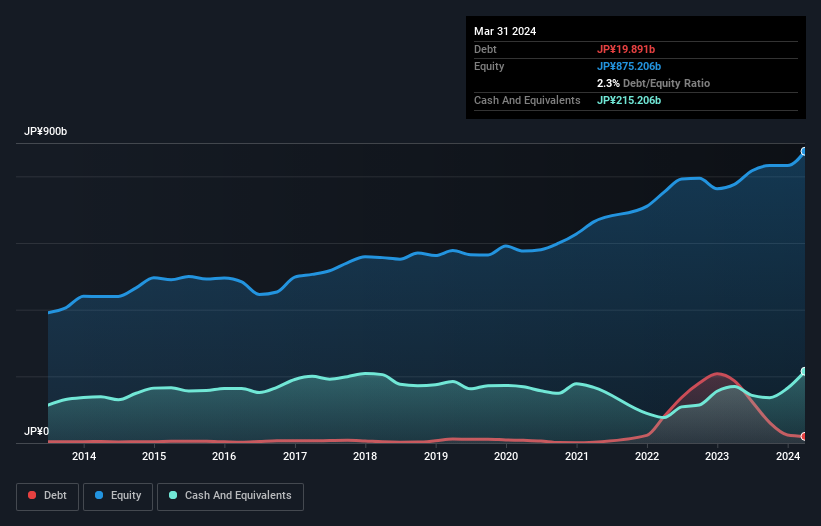
As you can see below, Makita had JP¥19.9b of debt at March 2024, down from JP¥186.4b a year prior. But it also has JP¥215.2b in cash to offset that, meaning it has JP¥195.3b net cash.
How Healthy Is Makita's Balance Sheet?
The latest balance sheet data shows that Makita had liabilities of JP¥145.5b due within a year, and liabilities of JP¥35.1b falling due after that. On the other hand, it had cash of JP¥215.2b and JP¥116.3b worth of receivables due within a year. So it actually has JP¥150.9b more liquid assets than total liabilities.
This surplus suggests that Makita has a conservative balance sheet, and could probably eliminate its debt without much difficulty. Succinctly put, Makita boasts net cash, so it's fair to say it does not have a heavy debt load!
Even more impressive was the fact that Makita grew its EBIT by 134% over twelve months. That boost will make it even easier to pay down debt going forward. There's no doubt that we learn most about debt from the balance sheet. But it is future earnings, more than anything, that will determine Makita's ability to maintain a healthy balance sheet going forward. So if you're focused on the future you can check out this free report showing analyst profit forecasts.
Finally, a business needs free cash flow to pay off debt; accounting profits just don't cut it. Makita may have net cash on the balance sheet, but it is still interesting to look at how well the business converts its earnings before interest and tax (EBIT) to free cash flow, because that will influence both its need for, and its capacity to manage debt. Looking at the most recent three years, Makita recorded free cash flow of 33% of its EBIT, which is weaker than we'd expect. That weak cash conversion makes it more difficult to handle indebtedness.
Summing Up
While it is always sensible to investigate a company's debt, in this case Makita has JP¥195.3b in net cash and a decent-looking balance sheet. And we liked the look of last year's 134% year-on-year EBIT growth. So is Makita's debt a risk? It doesn't seem so to us. Over time, share prices tend to follow earnings per share, so if you're interested in Makita, you may well want to click here to check an interactive graph of its earnings per share history.
At the end of the day, it's often better to focus on companies that are free from net debt. You can access our special list of such companies (all with a track record of profit growth). It's free.
New: Manage All Your Stock Portfolios in One Place
We've created the ultimate portfolio companion for stock investors, and it's free.
• Connect an unlimited number of Portfolios and see your total in one currency
• Be alerted to new Warning Signs or Risks via email or mobile
• Track the Fair Value of your stocks
Have feedback on this article? Concerned about the content? Get in touch with us directly. Alternatively, email editorial-team (at) simplywallst.com.
This article by Simply Wall St is general in nature. We provide commentary based on historical data and analyst forecasts only using an unbiased methodology and our articles are not intended to be financial advice. It does not constitute a recommendation to buy or sell any stock, and does not take account of your objectives, or your financial situation. We aim to bring you long-term focused analysis driven by fundamental data. Note that our analysis may not factor in the latest price-sensitive company announcements or qualitative material. Simply Wall St has no position in any stocks mentioned.
About TSE:6586
Makita
Engages in the manufacture and sale of electric power tools, pneumatic tools, and gardening and household equipment in Japan, Europe, North America, Asia, Australia, Brazil, and the United Arab Emirates.
Flawless balance sheet with proven track record.
Similar Companies
Market Insights

Community Narratives
