- Japan
- /
- Industrials
- /
- TSE:6501
Hitachi (TSE:6501) jumps 4.1% this week, though earnings growth is still tracking behind five-year shareholder returns


We think all investors should try to buy and hold high quality multi-year winners. And we've seen some truly amazing gains over the years. Don't believe it? Then look at the Hitachi, Ltd. (TSE:6501) share price. It's 370% higher than it was five years ago. And this is just one example of the epic gains achieved by some long term investors. In more good news, the share price has risen 19% in thirty days.
Since it's been a strong week for Hitachi shareholders, let's have a look at trend of the longer term fundamentals.
Check out our latest analysis for Hitachi
To quote Buffett, 'Ships will sail around the world but the Flat Earth Society will flourish. There will continue to be wide discrepancies between price and value in the marketplace...' One way to examine how market sentiment has changed over time is to look at the interaction between a company's share price and its earnings per share (EPS).
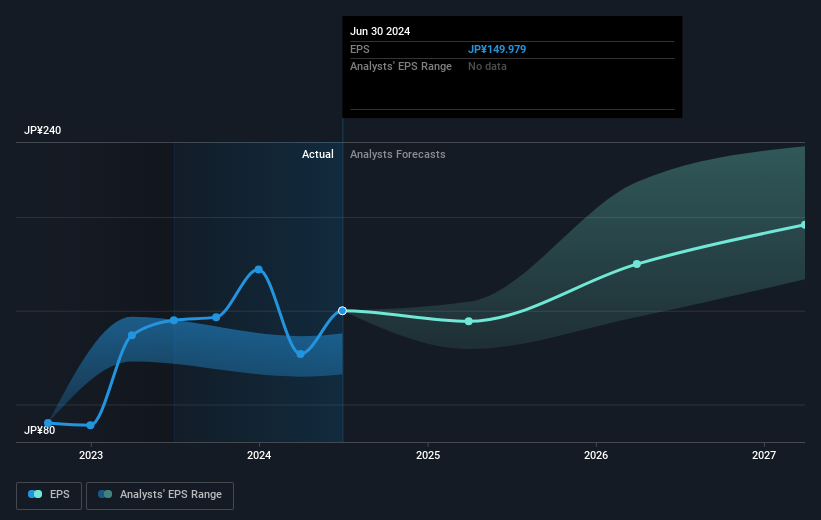
During five years of share price growth, Hitachi achieved compound earnings per share (EPS) growth of 24% per year. This EPS growth is lower than the 36% average annual increase in the share price. This suggests that market participants hold the company in higher regard, these days. And that's hardly shocking given the track record of growth.
You can see below how EPS has changed over time (discover the exact values by clicking on the image).
It might be well worthwhile taking a look at our free report on Hitachi's earnings, revenue and cash flow.
What About Dividends?
When looking at investment returns, it is important to consider the difference between total shareholder return (TSR) and share price return. The TSR incorporates the value of any spin-offs or discounted capital raisings, along with any dividends, based on the assumption that the dividends are reinvested. It's fair to say that the TSR gives a more complete picture for stocks that pay a dividend. We note that for Hitachi the TSR over the last 5 years was 420%, which is better than the share price return mentioned above. The dividends paid by the company have thusly boosted the total shareholder return.
A Different Perspective
We're pleased to report that Hitachi shareholders have received a total shareholder return of 113% over one year. Of course, that includes the dividend. That's better than the annualised return of 39% over half a decade, implying that the company is doing better recently. In the best case scenario, this may hint at some real business momentum, implying that now could be a great time to delve deeper. It's always interesting to track share price performance over the longer term. But to understand Hitachi better, we need to consider many other factors. Case in point: We've spotted 1 warning sign for Hitachi you should be aware of.
If you are like me, then you will not want to miss this free list of undervalued small caps that insiders are buying.
Please note, the market returns quoted in this article reflect the market weighted average returns of stocks that currently trade on Japanese exchanges.
Valuation is complex, but we're here to simplify it.
Discover if Hitachi might be undervalued or overvalued with our detailed analysis, featuring fair value estimates, potential risks, dividends, insider trades, and its financial condition.
Access Free AnalysisHave feedback on this article? Concerned about the content? Get in touch with us directly. Alternatively, email editorial-team (at) simplywallst.com.
This article by Simply Wall St is general in nature. We provide commentary based on historical data and analyst forecasts only using an unbiased methodology and our articles are not intended to be financial advice. It does not constitute a recommendation to buy or sell any stock, and does not take account of your objectives, or your financial situation. We aim to bring you long-term focused analysis driven by fundamental data. Note that our analysis may not factor in the latest price-sensitive company announcements or qualitative material. Simply Wall St has no position in any stocks mentioned.
About TSE:6501
Hitachi
Provides digital system and services, green energy and mobility, and connective industry solutions in Japan and internationally.
Flawless balance sheet average dividend payer.

