Kodama Chemical Industry Co.,Ltd.'s (TSE:4222) 41% Share Price Surge Not Quite Adding Up

Kodama Chemical Industry Co.,Ltd. (TSE:4222) shares have continued their recent momentum with a 41% gain in the last month alone. The last 30 days bring the annual gain to a very sharp 69%.
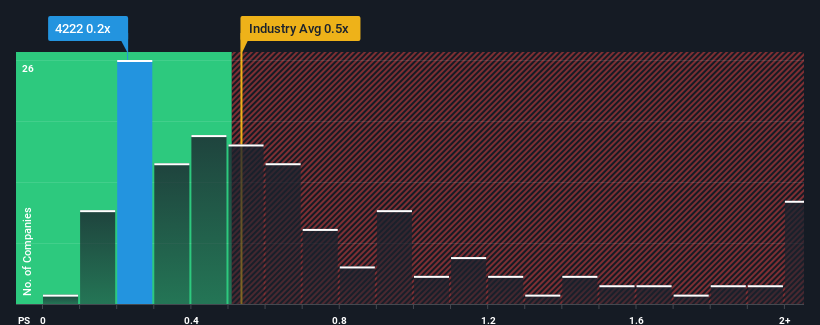
Although its price has surged higher, there still wouldn't be many who think Kodama Chemical IndustryLtd's price-to-sales (or "P/S") ratio of 0.2x is worth a mention when the median P/S in Japan's Chemicals industry is similar at about 0.5x. However, investors might be overlooking a clear opportunity or potential setback if there is no rational basis for the P/S.
Check out our latest analysis for Kodama Chemical IndustryLtd

What Does Kodama Chemical IndustryLtd's Recent Performance Look Like?
We'd have to say that with no tangible growth over the last year, Kodama Chemical IndustryLtd's revenue has been unimpressive. One possibility is that the P/S is moderate because investors think this benign revenue growth rate might not be enough to outperform the broader industry in the near future. If you like the company, you'd be hoping this isn't the case so that you could potentially pick up some stock while it's not quite in favour.
Although there are no analyst estimates available for Kodama Chemical IndustryLtd, take a look at this free data-rich visualisation to see how the company stacks up on earnings, revenue and cash flow.Is There Some Revenue Growth Forecasted For Kodama Chemical IndustryLtd?
The only time you'd be comfortable seeing a P/S like Kodama Chemical IndustryLtd's is when the company's growth is tracking the industry closely.
Retrospectively, the last year delivered virtually the same number to the company's top line as the year before. Whilst it's an improvement, it wasn't enough to get the company out of the hole it was in, with revenue down 1.1% overall from three years ago. Therefore, it's fair to say the revenue growth recently has been undesirable for the company.
Comparing that to the industry, which is predicted to deliver 5.1% growth in the next 12 months, the company's downward momentum based on recent medium-term revenue results is a sobering picture.
With this in mind, we find it worrying that Kodama Chemical IndustryLtd's P/S exceeds that of its industry peers. Apparently many investors in the company are way less bearish than recent times would indicate and aren't willing to let go of their stock right now. Only the boldest would assume these prices are sustainable as a continuation of recent revenue trends is likely to weigh on the share price eventually.
The Key Takeaway
Kodama Chemical IndustryLtd appears to be back in favour with a solid price jump bringing its P/S back in line with other companies in the industry Using the price-to-sales ratio alone to determine if you should sell your stock isn't sensible, however it can be a practical guide to the company's future prospects.
We find it unexpected that Kodama Chemical IndustryLtd trades at a P/S ratio that is comparable to the rest of the industry, despite experiencing declining revenues during the medium-term, while the industry as a whole is expected to grow. Even though it matches the industry, we're uncomfortable with the current P/S ratio, as this dismal revenue performance is unlikely to support a more positive sentiment for long. If recent medium-term revenue trends continue, it will place shareholders' investments at risk and potential investors in danger of paying an unnecessary premium.
Don't forget that there may be other risks. For instance, we've identified 2 warning signs for Kodama Chemical IndustryLtd (1 is concerning) you should be aware of.
If companies with solid past earnings growth is up your alley, you may wish to see this free collection of other companies with strong earnings growth and low P/E ratios.
Valuation is complex, but we're here to simplify it.
Discover if Kodama Chemical IndustryLtd might be undervalued or overvalued with our detailed analysis, featuring fair value estimates, potential risks, dividends, insider trades, and its financial condition.
Access Free AnalysisHave feedback on this article? Concerned about the content? Get in touch with us directly. Alternatively, email editorial-team (at) simplywallst.com.
This article by Simply Wall St is general in nature. We provide commentary based on historical data and analyst forecasts only using an unbiased methodology and our articles are not intended to be financial advice. It does not constitute a recommendation to buy or sell any stock, and does not take account of your objectives, or your financial situation. We aim to bring you long-term focused analysis driven by fundamental data. Note that our analysis may not factor in the latest price-sensitive company announcements or qualitative material. Simply Wall St has no position in any stocks mentioned.
About TSE:4222
Kodama Chemical IndustryLtd
Manufactures and sells plastic products in Japan and internationally.
Excellent balance sheet and good value.
Market Insights
Community Narratives


