
Advertisement
Union Tool Co. (TSE:6278) Stock Rockets 27% As Investors Are Less Pessimistic Than Expected

Union Tool Co. (TSE:6278) shares have continued their recent momentum with a 27% gain in the last month alone. Looking back a bit further, it's encouraging to see the stock is up 69% in the last year.
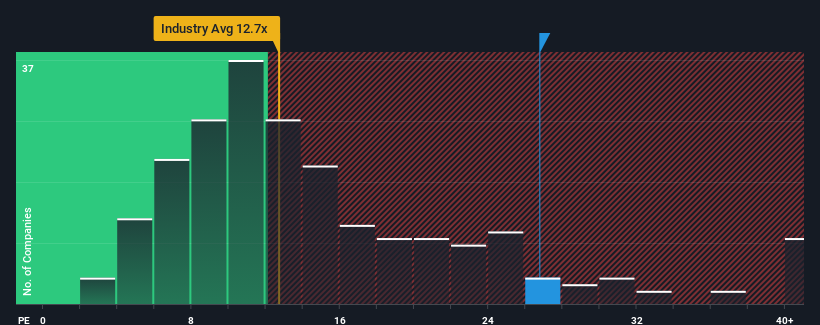
After such a large jump in price, Union Tool may be sending very bearish signals at the moment with a price-to-earnings (or "P/E") ratio of 26.8x, since almost half of all companies in Japan have P/E ratios under 14x and even P/E's lower than 9x are not unusual. However, the P/E might be quite high for a reason and it requires further investigation to determine if it's justified.
Union Tool could be doing better as its earnings have been going backwards lately while most other companies have been seeing positive earnings growth. It might be that many expect the dour earnings performance to recover substantially, which has kept the P/E from collapsing. You'd really hope so, otherwise you're paying a pretty hefty price for no particular reason.
View our latest analysis for Union Tool
Does Growth Match The High P/E?
In order to justify its P/E ratio, Union Tool would need to produce outstanding growth well in excess of the market.
If we review the last year of earnings, dishearteningly the company's profits fell to the tune of 23%. This has soured the latest three-year period, which nevertheless managed to deliver a decent 19% overall rise in EPS. Although it's been a bumpy ride, it's still fair to say the earnings growth recently has been mostly respectable for the company.
Turning to the outlook, the next three years should generate growth of 7.5% per year as estimated by the two analysts watching the company. That's shaping up to be similar to the 9.1% per annum growth forecast for the broader market.
In light of this, it's curious that Union Tool's P/E sits above the majority of other companies. It seems most investors are ignoring the fairly average growth expectations and are willing to pay up for exposure to the stock. These shareholders may be setting themselves up for disappointment if the P/E falls to levels more in line with the growth outlook.
The Bottom Line On Union Tool's P/E
Shares in Union Tool have built up some good momentum lately, which has really inflated its P/E. Typically, we'd caution against reading too much into price-to-earnings ratios when settling on investment decisions, though it can reveal plenty about what other market participants think about the company.
We've established that Union Tool currently trades on a higher than expected P/E since its forecast growth is only in line with the wider market. When we see an average earnings outlook with market-like growth, we suspect the share price is at risk of declining, sending the high P/E lower. Unless these conditions improve, it's challenging to accept these prices as being reasonable.
Many other vital risk factors can be found on the company's balance sheet. Take a look at our free balance sheet analysis for Union Tool with six simple checks on some of these key factors.
Of course, you might find a fantastic investment by looking at a few good candidates. So take a peek at this free list of companies with a strong growth track record, trading on a low P/E.
New: AI Stock Screener & Alerts
Our new AI Stock Screener scans the market every day to uncover opportunities.
• Dividend Powerhouses (3%+ Yield)
• Undervalued Small Caps with Insider Buying
• High growth Tech and AI Companies
Or build your own from over 50 metrics.
Have feedback on this article? Concerned about the content? Get in touch with us directly. Alternatively, email editorial-team (at) simplywallst.com.
This article by Simply Wall St is general in nature. We provide commentary based on historical data and analyst forecasts only using an unbiased methodology and our articles are not intended to be financial advice. It does not constitute a recommendation to buy or sell any stock, and does not take account of your objectives, or your financial situation. We aim to bring you long-term focused analysis driven by fundamental data. Note that our analysis may not factor in the latest price-sensitive company announcements or qualitative material. Simply Wall St has no position in any stocks mentioned.
About TSE:6278
Union Tool
Designs, manufactures, and sells of cutting tools, linear motion products, and metal machining equipment in Japan, China, Taiwan, and internationally.
Flawless balance sheet with solid track record and pays a dividend.
Similar Companies
Market Insights

Advertisement
Community Narratives

Apple: A Dying Star with an Overpriced Valuation
Fair Value US$177.34|19.2% overvalued
IN
Community Contributor
Avino a case for USD$20 per share within 5 years (assuming $3,500 gold, $100 silver and $4 copper).
Fair Value CA$26.79|86.0% undervalued
AG
Community Contributor
Riding the Defense Boom RENK Sees Revenue Climb at 15% CAGR by FY 2029
Fair Value €69.87|14.3% undervalued
CH
Community Contributor