Advertisement
Is OSG’s Strong 2025 Rally Justified After Latest Earnings Beat?

Simply Wall St
Reviewed by Bailey Pemberton
Let’s face it, deciding what to do with OSG stock can feel like flipping a coin, especially when the numbers keep shifting and headlines add fresh layers of uncertainty. If you’ve been following OSG, you already know there’s been a steady current of optimism. The stock is up 4.0% in the last week, 8.1% over the past month, and a whopping 20.4% year-to-date. That’s not just a blip, either; look further back and you’ll find OSG boasting a robust 45.3% gain over five years. It’s clear investors are noticing something, whether it’s new market opportunities or a shift in risk perception that’s caught Wall Street’s attention.
Yet, with all this momentum, there’s the big question every savvy investor must face: Is OSG priced right, or is the market getting ahead of itself? On valuation, the hard numbers give us a value score of 2 out of 6. That means OSG is undervalued on only two valuation checks, suggesting some strengths but also that bargain hunters might not have free rein just yet.
In the sections below, we’ll break down exactly how that value score gets calculated, dissecting the most common stock valuation methods. And, if you want the clearest view on OSG’s true worth, stick around to the end, where we’ll reveal an approach that digs even deeper into what really matters for shareholders.
OSG scores just 2/6 on our valuation checks. See what other red flags we found in the full valuation breakdown.
Approach 1: OSG Discounted Cash Flow (DCF) Analysis
The Discounted Cash Flow (DCF) model estimates a company's intrinsic value by projecting its future cash flows and discounting them back to today's terms. The main idea is to determine what OSG’s future cash generation is worth in today’s money, using realistic expectations and analyst estimates as the foundation.
For OSG, the latest reported Free Cash Flow (FCF) stands at ¥12.26 billion. Analyst forecasts extend about five years ahead, with FCF expected to climb steadily, reaching ¥15.6 billion by 2029. Beyond that, projections grow more cautious, relying on moderate annual increases as suggested by extrapolation methods. By 2035, these models suggest OSG could be generating up to ¥18.24 billion in annual FCF, all in today's yen.
When combining these figures, the DCF process values OSG at an estimated ¥3,171 per share. Compared to the current trading price, this implies the stock is 30.4% undervalued. In the current market, this discount stands out and suggests investors may be overlooking potential long-term value in the company’s cash flows.
Result: UNDERVALUED
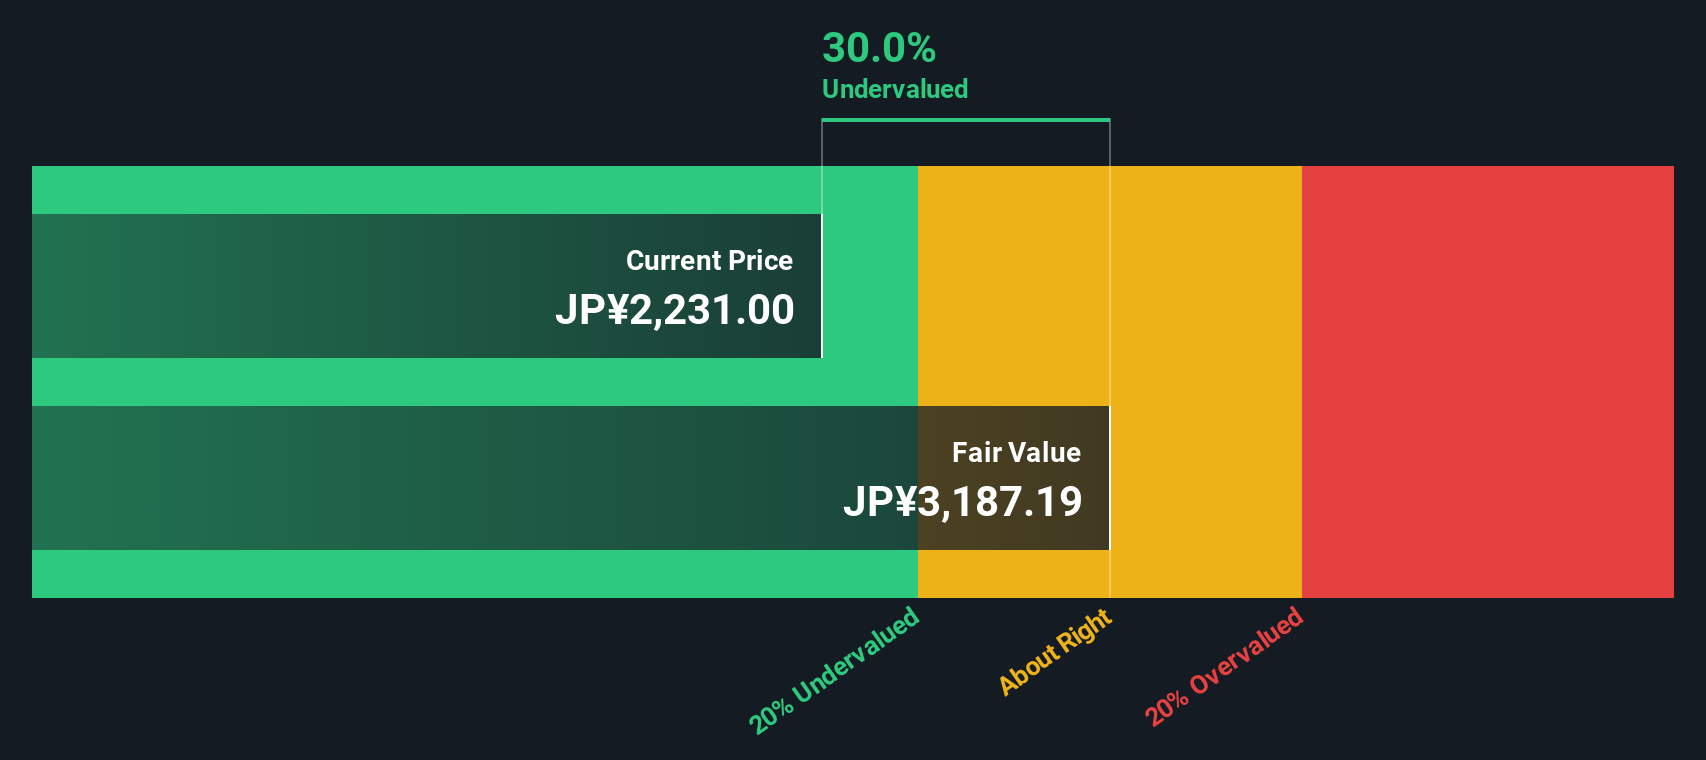
Our Discounted Cash Flow (DCF) analysis suggests OSG is undervalued by 30.4%. Track this in your watchlist or portfolio, or discover more undervalued stocks.
Approach 2: OSG Price vs Earnings
For most profitable companies, the Price-to-Earnings (PE) ratio is the preferred tool for quickly gauging value. The PE ratio reflects what investors are willing to pay for each yen of current earnings, making it especially effective when profits are stable and predictable, as is the case for OSG.
Growth expectations and market risks play a major role in determining what constitutes a “fair” PE ratio. Companies with brighter growth prospects or lower risk can command higher PE ratios, while those facing headwinds tend to trade closer to or even below the industry average.
Currently, OSG has a PE ratio of 14.23x, which sits above both the Machinery industry average of 13.55x and the peer average of 12.29x. At first glance, this might make OSG look a touch expensive relative to its direct competition.
This is where Simply Wall St’s “Fair Ratio” comes in. Calculated based on the company’s earnings growth, industry, profit margins, market cap and relevant risks, the Fair Ratio for OSG stands at 13.49x. Unlike a simple comparison to industry or peer averages, this proprietary measure gives a more nuanced and tailored view of what OSG's multiple should be given its unique circumstances.
Since OSG’s current PE ratio of 14.23x is just slightly higher than its Fair Ratio of 13.49x, the valuation is close enough to be considered reasonable, without strong evidence of either significant under- or over-valuation.
Result: ABOUT RIGHT

PE ratios tell one story, but what if the real opportunity lies elsewhere? Discover companies where insiders are betting big on explosive growth.
Upgrade Your Decision Making: Choose your OSG Narrative
Earlier we mentioned that there is an even better way to understand valuation, so let’s introduce you to Narratives. A Narrative is your personal story about a company’s future, combining what you believe about revenue growth, profit margins, and fair value with the latest data, all in one place. Narratives empower you to connect OSG’s business story directly to its financial forecast and a custom fair value estimate, helping make sense of what the numbers really mean for your investment decisions.
Available to millions of investors on Simply Wall St’s Community page, Narratives make it easy and accessible to shape and share your outlook. As new information like earnings or breaking news hits, Narratives update dynamically, ensuring your views stay relevant and actionable. With Narratives, you can confidently compare your fair value to today’s market price and decide if it is the right moment to buy or sell.
For instance, two investors might look at OSG: one forecasts strong growth with a fair value of ¥3,780 per share, while another expects slower progress, estimating just ¥2,600. This highlights how your Narrative guides your investment decisions based on your perspective.
Do you think there's more to the story for OSG? Create your own Narrative to let the Community know!

This article by Simply Wall St is general in nature. We provide commentary based on historical data and analyst forecasts only using an unbiased methodology and our articles are not intended to be financial advice. It does not constitute a recommendation to buy or sell any stock, and does not take account of your objectives, or your financial situation. We aim to bring you long-term focused analysis driven by fundamental data. Note that our analysis may not factor in the latest price-sensitive company announcements or qualitative material. Simply Wall St has no position in any stocks mentioned.
New: AI Stock Screener & Alerts
Our new AI Stock Screener scans the market every day to uncover opportunities.
• Dividend Powerhouses (3%+ Yield)
• Undervalued Small Caps with Insider Buying
• High growth Tech and AI Companies
Or build your own from over 50 metrics.
Have feedback on this article? Concerned about the content? Get in touch with us directly. Alternatively, email editorial-team@simplywallst.com
About TSE:6136
OSG
Manufactures and sells precision machinery tools in Japan, the Americas, Europe, Africa, and Asia.
Flawless balance sheet average dividend payer.
Market Insights

Advertisement
Community Narratives
A formidable player in AI and enterprise computing.
Fair Value US$210.00|3.9% overvalued
CO
Community Contributor
IREN's Bold Moves in Sustainable Bitcoin Mining & AI Data Centers
Fair Value US$89.00|21.8% undervalued
BL
Community Contributor
Cooling the Champions: The Aussie Tech Behind F1's Victories
Fair Value AU$12.40|40.6% undervalued
TR
Community Contributor