
Advertisement
Key Insights
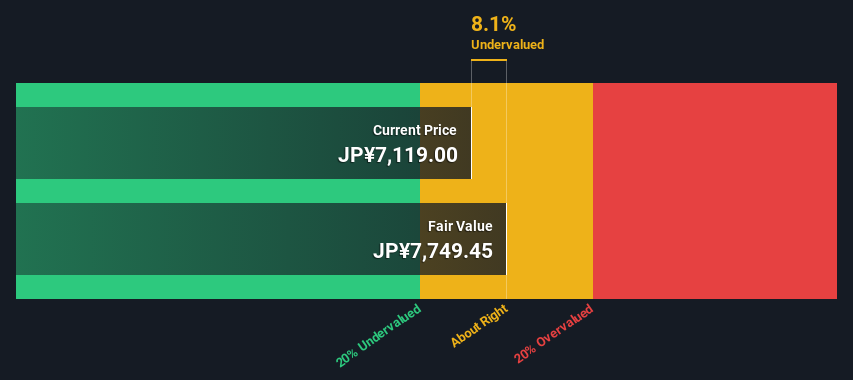
- Okuma's estimated fair value is JP¥7,749 based on 2 Stage Free Cash Flow to Equity
- Current share price of JP¥7,119 suggests Okuma is potentially trading close to its fair value
- Analyst price target for 6103 is JP¥7,260 which is 6.3% below our fair value estimate
Today we'll do a simple run through of a valuation method used to estimate the attractiveness of Okuma Corporation (TSE:6103) as an investment opportunity by estimating the company's future cash flows and discounting them to their present value. Our analysis will employ the Discounted Cash Flow (DCF) model. Don't get put off by the jargon, the math behind it is actually quite straightforward.
Remember though, that there are many ways to estimate a company's value, and a DCF is just one method. Anyone interested in learning a bit more about intrinsic value should have a read of the Simply Wall St analysis model.
Check out our latest analysis for Okuma
Crunching The Numbers
We're using the 2-stage growth model, which simply means we take in account two stages of company's growth. In the initial period the company may have a higher growth rate and the second stage is usually assumed to have a stable growth rate. To start off with, we need to estimate the next ten years of cash flows. Where possible we use analyst estimates, but when these aren't available we extrapolate the previous free cash flow (FCF) from the last estimate or reported value. We assume companies with shrinking free cash flow will slow their rate of shrinkage, and that companies with growing free cash flow will see their growth rate slow, over this period. We do this to reflect that growth tends to slow more in the early years than it does in later years.
Generally we assume that a dollar today is more valuable than a dollar in the future, and so the sum of these future cash flows is then discounted to today's value:
10-year free cash flow (FCF) estimate
| 2024 | 2025 | 2026 | 2027 | 2028 | 2029 | 2030 | 2031 | 2032 | 2033 | |
| Levered FCF (¥, Millions) | JP¥3.33b | JP¥17.1b | JP¥15.0b | JP¥13.5b | JP¥15.5b | JP¥15.1b | JP¥14.8b | JP¥14.6b | JP¥14.4b | JP¥14.3b |
| Growth Rate Estimate Source | Analyst x1 | Analyst x2 | Analyst x2 | Analyst x1 | Analyst x1 | Est @ -2.90% | Est @ -1.98% | Est @ -1.34% | Est @ -0.89% | Est @ -0.57% |
| Present Value (¥, Millions) Discounted @ 6.0% | JP¥3.1k | JP¥15.3k | JP¥12.6k | JP¥10.7k | JP¥11.6k | JP¥10.6k | JP¥9.8k | JP¥9.1k | JP¥8.5k | JP¥8.0k |
("Est" = FCF growth rate estimated by Simply Wall St)
Present Value of 10-year Cash Flow (PVCF) = JP¥99b
After calculating the present value of future cash flows in the initial 10-year period, we need to calculate the Terminal Value, which accounts for all future cash flows beyond the first stage. The Gordon Growth formula is used to calculate Terminal Value at a future annual growth rate equal to the 5-year average of the 10-year government bond yield of 0.2%. We discount the terminal cash flows to today's value at a cost of equity of 6.0%.
Terminal Value (TV)= FCF2033 × (1 + g) ÷ (r – g) = JP¥14b× (1 + 0.2%) ÷ (6.0%– 0.2%) = JP¥246b
Present Value of Terminal Value (PVTV)= TV / (1 + r)10= JP¥246b÷ ( 1 + 6.0%)10= JP¥138b
The total value is the sum of cash flows for the next ten years plus the discounted terminal value, which results in the Total Equity Value, which in this case is JP¥237b. In the final step we divide the equity value by the number of shares outstanding. Compared to the current share price of JP¥7.1k, the company appears about fair value at a 8.1% discount to where the stock price trades currently. Valuations are imprecise instruments though, rather like a telescope - move a few degrees and end up in a different galaxy. Do keep this in mind.
Important Assumptions
Now the most important inputs to a discounted cash flow are the discount rate, and of course, the actual cash flows. You don't have to agree with these inputs, I recommend redoing the calculations yourself and playing with them. The DCF also does not consider the possible cyclicality of an industry, or a company's future capital requirements, so it does not give a full picture of a company's potential performance. Given that we are looking at Okuma as potential shareholders, the cost of equity is used as the discount rate, rather than the cost of capital (or weighted average cost of capital, WACC) which accounts for debt. In this calculation we've used 6.0%, which is based on a levered beta of 1.036. Beta is a measure of a stock's volatility, compared to the market as a whole. We get our beta from the industry average beta of globally comparable companies, with an imposed limit between 0.8 and 2.0, which is a reasonable range for a stable business.
SWOT Analysis for Okuma
Strength
- Debt is not viewed as a risk.
Weakness
- Earnings declined over the past year.
- Dividend is low compared to the top 25% of dividend payers in the Machinery market.
Opportunity
- Annual earnings are forecast to grow for the next 3 years.
- Good value based on P/E ratio and estimated fair value.
Threat
- Paying a dividend but company has no free cash flows.
- Annual earnings are forecast to grow slower than the Japanese market.
Next Steps:
Although the valuation of a company is important, it shouldn't be the only metric you look at when researching a company. It's not possible to obtain a foolproof valuation with a DCF model. Rather it should be seen as a guide to "what assumptions need to be true for this stock to be under/overvalued?" For example, changes in the company's cost of equity or the risk free rate can significantly impact the valuation. For Okuma, there are three further aspects you should consider:
- Risks: Case in point, we've spotted 1 warning sign for Okuma you should be aware of.
- Future Earnings: How does 6103's growth rate compare to its peers and the wider market? Dig deeper into the analyst consensus number for the upcoming years by interacting with our free analyst growth expectation chart.
- Other High Quality Alternatives: Do you like a good all-rounder? Explore our interactive list of high quality stocks to get an idea of what else is out there you may be missing!
PS. The Simply Wall St app conducts a discounted cash flow valuation for every stock on the TSE every day. If you want to find the calculation for other stocks just search here.
New: AI Stock Screener & Alerts
Our new AI Stock Screener scans the market every day to uncover opportunities.
• Dividend Powerhouses (3%+ Yield)
• Undervalued Small Caps with Insider Buying
• High growth Tech and AI Companies
Or build your own from over 50 metrics.
Have feedback on this article? Concerned about the content? Get in touch with us directly. Alternatively, email editorial-team (at) simplywallst.com.
This article by Simply Wall St is general in nature. We provide commentary based on historical data and analyst forecasts only using an unbiased methodology and our articles are not intended to be financial advice. It does not constitute a recommendation to buy or sell any stock, and does not take account of your objectives, or your financial situation. We aim to bring you long-term focused analysis driven by fundamental data. Note that our analysis may not factor in the latest price-sensitive company announcements or qualitative material. Simply Wall St has no position in any stocks mentioned.
About TSE:6103
Okuma
Manufactures and sells machine tools in Japan, the United States, Europe, and Asia/Pacific.
Excellent balance sheet with moderate growth potential.
Similar Companies
Market Insights

Advertisement
Community Narratives
America Wants Homegrown Drones — Draganfly Is Ready to Deliver
Fair Value US$9.21|33.8% undervalued
JO
Community Contributor
Cheesecake Factory offers an enticing opportunity for long-term growth by leveraging new concepts
Fair Value US$73.83|26.3% undervalued
ZW
Community Contributor
Coca-Cola’s Intrinsic Value Set to Rise with Fed Rate Cut
Fair Value US$67.50|1.2% undervalued
AL
Community Contributor
Fully Permitted Gold Mine with 50 Baggers Potential 
Fair Value CA$41.00|98.6% undervalued
RO
Community Contributor