
Advertisement
- Japan
- /
- Electrical
- /
- TSE:5801
Some Investors May Be Worried About Furukawa Electric's (TSE:5801) Returns On Capital

What financial metrics can indicate to us that a company is maturing or even in decline? A business that's potentially in decline often shows two trends, a return on capital employed (ROCE) that's declining, and a base of capital employed that's also declining. This indicates the company is producing less profit from its investments and its total assets are decreasing. In light of that, from a first glance at Furukawa Electric (TSE:5801), we've spotted some signs that it could be struggling, so let's investigate.
What Is Return On Capital Employed (ROCE)?
For those that aren't sure what ROCE is, it measures the amount of pre-tax profits a company can generate from the capital employed in its business. To calculate this metric for Furukawa Electric, this is the formula:
Return on Capital Employed = Earnings Before Interest and Tax (EBIT) ÷ (Total Assets - Current Liabilities)
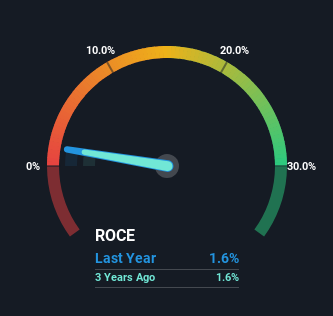
0.016 = JP¥8.9b ÷ (JP¥965b - JP¥401b) (Based on the trailing twelve months to December 2023).
Therefore, Furukawa Electric has an ROCE of 1.6%. Ultimately, that's a low return and it under-performs the Electrical industry average of 8.5%.
Check out our latest analysis for Furukawa Electric
In the above chart we have measured Furukawa Electric's prior ROCE against its prior performance, but the future is arguably more important. If you're interested, you can view the analysts predictions in our free analyst report for Furukawa Electric .
What Can We Tell From Furukawa Electric's ROCE Trend?
There is reason to be cautious about Furukawa Electric, given the returns are trending downwards. About five years ago, returns on capital were 8.6%, however they're now substantially lower than that as we saw above. And on the capital employed front, the business is utilizing roughly the same amount of capital as it was back then. Companies that exhibit these attributes tend to not be shrinking, but they can be mature and facing pressure on their margins from competition. So because these trends aren't typically conducive to creating a multi-bagger, we wouldn't hold our breath on Furukawa Electric becoming one if things continue as they have.
On a separate but related note, it's important to know that Furukawa Electric has a current liabilities to total assets ratio of 42%, which we'd consider pretty high. This effectively means that suppliers (or short-term creditors) are funding a large portion of the business, so just be aware that this can introduce some elements of risk. While it's not necessarily a bad thing, it can be beneficial if this ratio is lower.
The Key Takeaway
In the end, the trend of lower returns on the same amount of capital isn't typically an indication that we're looking at a growth stock. Investors must expect better things on the horizon though because the stock has risen 24% in the last five years. Regardless, we don't like the trends as they are and if they persist, we think you might find better investments elsewhere.
If you'd like to know about the risks facing Furukawa Electric, we've discovered 2 warning signs that you should be aware of.
While Furukawa Electric may not currently earn the highest returns, we've compiled a list of companies that currently earn more than 25% return on equity. Check out this free list here.
New: AI Stock Screener & Alerts
Our new AI Stock Screener scans the market every day to uncover opportunities.
• Dividend Powerhouses (3%+ Yield)
• Undervalued Small Caps with Insider Buying
• High growth Tech and AI Companies
Or build your own from over 50 metrics.
Have feedback on this article? Concerned about the content? Get in touch with us directly. Alternatively, email editorial-team (at) simplywallst.com.
This article by Simply Wall St is general in nature. We provide commentary based on historical data and analyst forecasts only using an unbiased methodology and our articles are not intended to be financial advice. It does not constitute a recommendation to buy or sell any stock, and does not take account of your objectives, or your financial situation. We aim to bring you long-term focused analysis driven by fundamental data. Note that our analysis may not factor in the latest price-sensitive company announcements or qualitative material. Simply Wall St has no position in any stocks mentioned.
About TSE:5801
Furukawa Electric
Manufactures and sells telecommunications, energy, automobile, electronic, and construction products worldwide.
Solid track record and good value.
Similar Companies
Market Insights

Advertisement
Community Narratives

Apple: A Dying Star with an Overpriced Valuation
Fair Value US$177.34|19.1% overvalued
IN
Community Contributor
Avino a case for USD$20 per share within 5 years (assuming $3,500 gold, $100 silver and $4 copper).
Fair Value CA$26.79|86.0% undervalued
AG
Community Contributor
Riding the Defense Boom RENK Sees Revenue Climb at 15% CAGR by FY 2029
Fair Value €69.87|14.3% undervalued
CH
Community Contributor