
Advertisement
- Japan
- /
- Electrical
- /
- TSE:5801
Furukawa Electric (TSE:5801) sheds 17% this week, as yearly returns fall more in line with earnings growth

The last three months have been tough on Furukawa Electric Co., Ltd. (TSE:5801) shareholders, who have seen the share price decline a rather worrying 38%. But in stark contrast, the returns over the last half decade have impressed. We think most investors would be happy with the 122% return, over that period. So while it's never fun to see a share price fall, it's important to look at a longer time horizon. Of course, that doesn't necessarily mean it's cheap now.
While the stock has fallen 17% this week, it's worth focusing on the longer term and seeing if the stocks historical returns have been driven by the underlying fundamentals.
To quote Buffett, 'Ships will sail around the world but the Flat Earth Society will flourish. There will continue to be wide discrepancies between price and value in the marketplace...' One imperfect but simple way to consider how the market perception of a company has shifted is to compare the change in the earnings per share (EPS) with the share price movement.
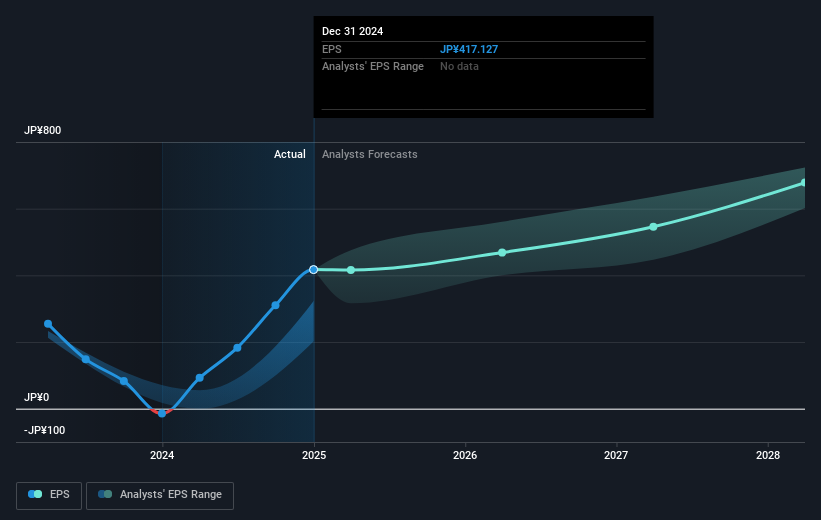
During the last half decade, Furukawa Electric became profitable. Sometimes, the start of profitability is a major inflection point that can signal fast earnings growth to come, which in turn justifies very strong share price gains.
You can see how EPS has changed over time in the image below (click on the chart to see the exact values).
We know that Furukawa Electric has improved its bottom line over the last three years, but what does the future have in store? Take a more thorough look at Furukawa Electric's financial health with this free report on its balance sheet .
What About Dividends?
It is important to consider the total shareholder return, as well as the share price return, for any given stock. The TSR is a return calculation that accounts for the value of cash dividends (assuming that any dividend received was reinvested) and the calculated value of any discounted capital raisings and spin-offs. It's fair to say that the TSR gives a more complete picture for stocks that pay a dividend. In the case of Furukawa Electric, it has a TSR of 151% for the last 5 years. That exceeds its share price return that we previously mentioned. This is largely a result of its dividend payments!
A Different Perspective
It's good to see that Furukawa Electric has rewarded shareholders with a total shareholder return of 44% in the last twelve months. Of course, that includes the dividend. That gain is better than the annual TSR over five years, which is 20%. Therefore it seems like sentiment around the company has been positive lately. Someone with an optimistic perspective could view the recent improvement in TSR as indicating that the business itself is getting better with time. It's always interesting to track share price performance over the longer term. But to understand Furukawa Electric better, we need to consider many other factors. Consider for instance, the ever-present spectre of investment risk. We've identified 3 warning signs with Furukawa Electric (at least 2 which are significant) , and understanding them should be part of your investment process.
But note: Furukawa Electric may not be the best stock to buy. So take a peek at this free list of interesting companies with past earnings growth (and further growth forecast).
Please note, the market returns quoted in this article reflect the market weighted average returns of stocks that currently trade on Japanese exchanges.
New: AI Stock Screener & Alerts
Our new AI Stock Screener scans the market every day to uncover opportunities.
• Dividend Powerhouses (3%+ Yield)
• Undervalued Small Caps with Insider Buying
• High growth Tech and AI Companies
Or build your own from over 50 metrics.
Have feedback on this article? Concerned about the content? Get in touch with us directly. Alternatively, email editorial-team (at) simplywallst.com.
This article by Simply Wall St is general in nature. We provide commentary based on historical data and analyst forecasts only using an unbiased methodology and our articles are not intended to be financial advice. It does not constitute a recommendation to buy or sell any stock, and does not take account of your objectives, or your financial situation. We aim to bring you long-term focused analysis driven by fundamental data. Note that our analysis may not factor in the latest price-sensitive company announcements or qualitative material. Simply Wall St has no position in any stocks mentioned.
About TSE:5801
Furukawa Electric
Manufactures and sells telecommunications, energy, automobile, electronic, and construction products worldwide.
Undervalued with mediocre balance sheet.
Similar Companies
Market Insights


Advertisement
Community Narratives

Quality Assets, Cautious Expansion and Commodity Super-cycle To Deliver Steady Revenue Growth 
Fair Value US$20.44|13.6% undervalued
ST
Equity Analyst and Writer
Tullow Oil's Share Price Could Soar Up to 135% if Oil Holds at $70
Fair Value UK£0.45|69.8% undervalued
OI
Community Contributor