
Advertisement
- Japan
- /
- Construction
- /
- TSE:1899
Further Upside For Fukuda Corporation (TSE:1899) Shares Could Introduce Price Risks After 25% Bounce
Despite an already strong run, Fukuda Corporation (TSE:1899) shares have been powering on, with a gain of 25% in the last thirty days. Looking back a bit further, it's encouraging to see the stock is up 25% in the last year.
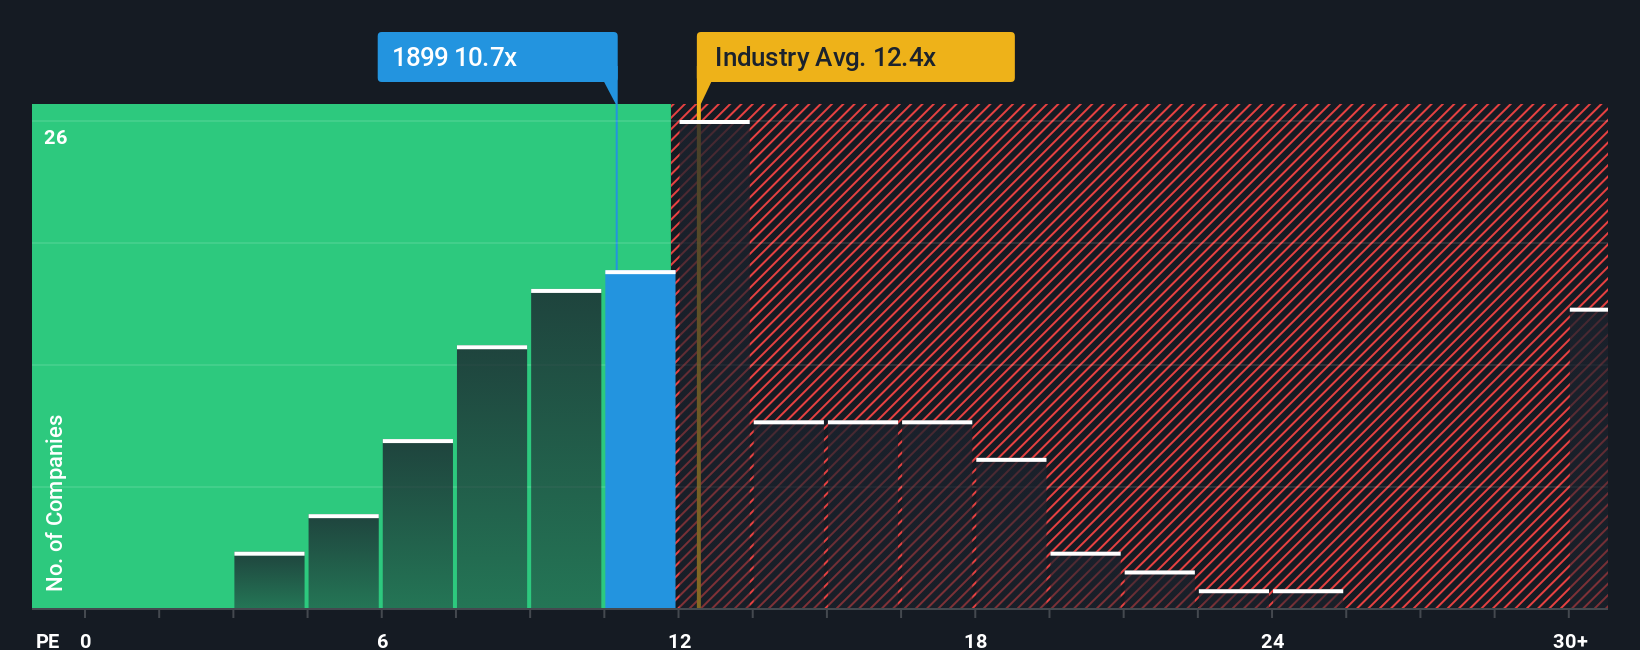
Although its price has surged higher, given about half the companies in Japan have price-to-earnings ratios (or "P/E's") above 15x, you may still consider Fukuda as an attractive investment with its 10.7x P/E ratio. Although, it's not wise to just take the P/E at face value as there may be an explanation why it's limited.
Fukuda has been doing a good job lately as it's been growing earnings at a solid pace. It might be that many expect the respectable earnings performance to degrade substantially, which has repressed the P/E. If you like the company, you'd be hoping this isn't the case so that you could potentially pick up some stock while it's out of favour.
View our latest analysis for Fukuda
What Are Growth Metrics Telling Us About The Low P/E?
Fukuda's P/E ratio would be typical for a company that's only expected to deliver limited growth, and importantly, perform worse than the market.
Taking a look back first, we see that the company managed to grow earnings per share by a handy 15% last year. Pleasingly, EPS has also lifted 39% in aggregate from three years ago, partly thanks to the last 12 months of growth. So we can start by confirming that the company has done a great job of growing earnings over that time.
Weighing that recent medium-term earnings trajectory against the broader market's one-year forecast for expansion of 11% shows it's about the same on an annualised basis.
With this information, we find it odd that Fukuda is trading at a P/E lower than the market. Apparently some shareholders are more bearish than recent times would indicate and have been accepting lower selling prices.
The Bottom Line On Fukuda's P/E
Fukuda's stock might have been given a solid boost, but its P/E certainly hasn't reached any great heights. It's argued the price-to-earnings ratio is an inferior measure of value within certain industries, but it can be a powerful business sentiment indicator.
We've established that Fukuda currently trades on a lower than expected P/E since its recent three-year growth is in line with the wider market forecast. When we see average earnings with market-like growth, we assume potential risks are what might be placing pressure on the P/E ratio. At least the risk of a price drop looks to be subdued if recent medium-term earnings trends continue, but investors seem to think future earnings could see some volatility.
Don't forget that there may be other risks. For instance, we've identified 3 warning signs for Fukuda (2 are a bit concerning) you should be aware of.
If these risks are making you reconsider your opinion on Fukuda, explore our interactive list of high quality stocks to get an idea of what else is out there.
New: AI Stock Screener & Alerts
Our new AI Stock Screener scans the market every day to uncover opportunities.
• Dividend Powerhouses (3%+ Yield)
• Undervalued Small Caps with Insider Buying
• High growth Tech and AI Companies
Or build your own from over 50 metrics.
Have feedback on this article? Concerned about the content? Get in touch with us directly. Alternatively, email editorial-team (at) simplywallst.com.
This article by Simply Wall St is general in nature. We provide commentary based on historical data and analyst forecasts only using an unbiased methodology and our articles are not intended to be financial advice. It does not constitute a recommendation to buy or sell any stock, and does not take account of your objectives, or your financial situation. We aim to bring you long-term focused analysis driven by fundamental data. Note that our analysis may not factor in the latest price-sensitive company announcements or qualitative material. Simply Wall St has no position in any stocks mentioned.
About TSE:1899
Excellent balance sheet average dividend payer.
Market Insights


Advertisement
Community Narratives
America Wants Homegrown Drones — Draganfly Is Ready to Deliver
Fair Value US$9.21|33.9% undervalued
JO
Community Contributor
Cheesecake Factory offers an enticing opportunity for long-term growth by leveraging new concepts
Fair Value US$73.83|26.5% undervalued
ZW
Community Contributor
Coca-Cola’s Intrinsic Value Set to Rise with Fed Rate Cut
Fair Value US$67.50|2.3% undervalued
AL
Community Contributor
Fully Permitted Gold Mine with 50 Baggers Potential 
Fair Value CA$41.00|98.0% undervalued
RO
Community Contributor