Mizuho Financial Group, Inc. (TSE:8411) surges 6.5%; individual investors who own 59% shares profited along with institutions


Key Insights
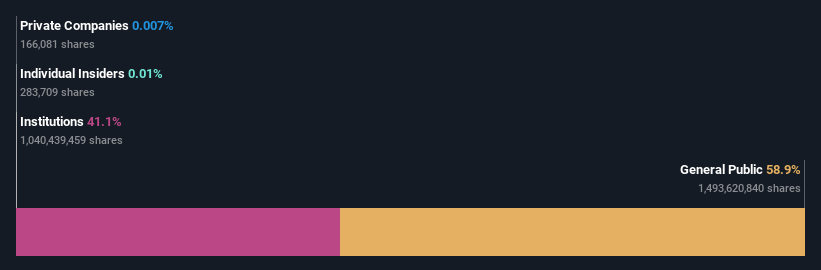
- The considerable ownership by individual investors in Mizuho Financial Group indicates that they collectively have a greater say in management and business strategy
- 36% of the business is held by the top 25 shareholders
- Institutional ownership in Mizuho Financial Group is 41%
A look at the shareholders of Mizuho Financial Group, Inc. (TSE:8411) can tell us which group is most powerful. With 59% stake, individual investors possess the maximum shares in the company. Put another way, the group faces the maximum upside potential (or downside risk).
Individual investors gained the most after market cap touched JP¥8.3t last week, while institutions who own 41% also benefitted.
Let's delve deeper into each type of owner of Mizuho Financial Group, beginning with the chart below.
See our latest analysis for Mizuho Financial Group
What Does The Institutional Ownership Tell Us About Mizuho Financial Group?
Many institutions measure their performance against an index that approximates the local market. So they usually pay more attention to companies that are included in major indices.
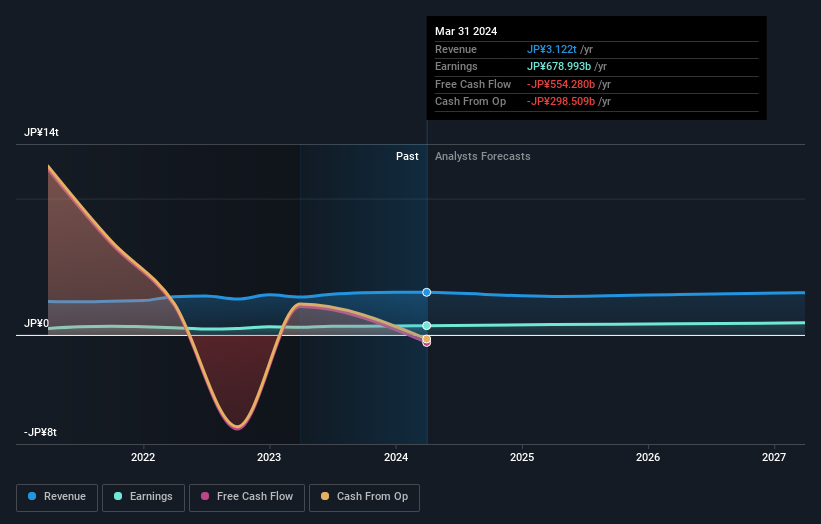
As you can see, institutional investors have a fair amount of stake in Mizuho Financial Group. This can indicate that the company has a certain degree of credibility in the investment community. However, it is best to be wary of relying on the supposed validation that comes with institutional investors. They too, get it wrong sometimes. If multiple institutions change their view on a stock at the same time, you could see the share price drop fast. It's therefore worth looking at Mizuho Financial Group's earnings history below. Of course, the future is what really matters.
Mizuho Financial Group is not owned by hedge funds. BlackRock, Inc. is currently the largest shareholder, with 7.4% of shares outstanding. With 4.4% and 3.9% of the shares outstanding respectively, Nomura Asset Management Co., Ltd. and The Vanguard Group, Inc. are the second and third largest shareholders.
Our studies suggest that the top 25 shareholders collectively control less than half of the company's shares, meaning that the company's shares are widely disseminated and there is no dominant shareholder.
Researching institutional ownership is a good way to gauge and filter a stock's expected performance. The same can be achieved by studying analyst sentiments. Quite a few analysts cover the stock, so you could look into forecast growth quite easily.
Insider Ownership Of Mizuho Financial Group
While the precise definition of an insider can be subjective, almost everyone considers board members to be insiders. The company management answer to the board and the latter should represent the interests of shareholders. Notably, sometimes top-level managers are on the board themselves.
Most consider insider ownership a positive because it can indicate the board is well aligned with other shareholders. However, on some occasions too much power is concentrated within this group.
Our data suggests that insiders own under 1% of Mizuho Financial Group, Inc. in their own names. It is a very large company, so it would be surprising to see insiders own a large proportion of the company. Though their holding amounts to less than 1%, we can see that board members collectively own JP¥931m worth of shares (at current prices). It is good to see board members owning shares, but it might be worth checking if those insiders have been buying.
General Public Ownership
The general public, who are usually individual investors, hold a substantial 59% stake in Mizuho Financial Group, suggesting it is a fairly popular stock. This size of ownership gives investors from the general public some collective power. They can and probably do influence decisions on executive compensation, dividend policies and proposed business acquisitions.
Next Steps:
I find it very interesting to look at who exactly owns a company. But to truly gain insight, we need to consider other information, too.
I like to dive deeper into how a company has performed in the past. You can access this interactive graph of past earnings, revenue and cash flow, for free.
Ultimately the future is most important. You can access this free report on analyst forecasts for the company.
NB: Figures in this article are calculated using data from the last twelve months, which refer to the 12-month period ending on the last date of the month the financial statement is dated. This may not be consistent with full year annual report figures.
New: Manage All Your Stock Portfolios in One Place
We've created the ultimate portfolio companion for stock investors, and it's free.
• Connect an unlimited number of Portfolios and see your total in one currency
• Be alerted to new Warning Signs or Risks via email or mobile
• Track the Fair Value of your stocks
Have feedback on this article? Concerned about the content? Get in touch with us directly. Alternatively, email editorial-team (at) simplywallst.com.
This article by Simply Wall St is general in nature. We provide commentary based on historical data and analyst forecasts only using an unbiased methodology and our articles are not intended to be financial advice. It does not constitute a recommendation to buy or sell any stock, and does not take account of your objectives, or your financial situation. We aim to bring you long-term focused analysis driven by fundamental data. Note that our analysis may not factor in the latest price-sensitive company announcements or qualitative material. Simply Wall St has no position in any stocks mentioned.
Have feedback on this article? Concerned about the content? Get in touch with us directly. Alternatively, email editorial-team@simplywallst.com
About TSE:8411
Mizuho Financial Group
Engages in banking, trust, securities, and other businesses related to financial services in Japan, the Americas, Europe, Asia/Oceania, and internationally.
Solid track record, good value and pays a dividend.
