Advertisement
Assessing Fukuoka Financial Group (TSE:8354) Valuation as Recent Gains Give Way to Quiet Trading

Simply Wall St
Reviewed by Simply Wall St
Are you watching Fukuoka Financial Group (TSE:8354) closely this week? With the company’s shares moving quietly under the radar, investors are starting to wonder whether something is brewing behind the scenes, or if this is simply the calm before a valuation re-shuffle. When a stock slips in and out of favor without a clear catalyst, it can be a real signal, or just noise. Deciding which it is can make all the difference.
Over the past year, Fukuoka Financial Group’s share price has delivered a substantial 24% total return, significantly outpacing gains earlier in the year and continuing a trend of steady appreciation over several years. However, recent weeks have brought some choppiness, with slight declines this month and a modest pullback over the past week, despite momentum picking up over the past quarter. The company’s consistent revenue and improving net income growth add another layer to the story, but markets are still weighing whether this is a pause in a longer upward move or something more cautionary.
After a year of strong gains followed by a quieter period, is Fukuoka Financial Group poised for another leap higher, or are investors already pricing in its next stage of growth?
Price-to-Earnings of 11.1x: Is it justified?
Fukuoka Financial Group is currently trading at a price-to-earnings (P/E) ratio of 11.1x, which positions it as undervalued compared to both its industry peers and the broader banking sector. The average P/E ratio for Japanese banks is slightly higher at 11.2x, while the peer group average is even higher at 16.7x. By comparison, this suggests that the market is applying a discount to Fukuoka Financial Group’s earnings relative to comparable companies.
The P/E ratio measures how much investors are willing to pay for one unit of a company’s earnings. For banks, it is a widely used tool because it reflects growth expectations, profitability, and relative risk. In this case, a lower P/E may imply the market has modest expectations for future profit growth or is overlooking steady earnings delivery.
While the company’s P/E ratio signals an undervalued situation, it also hints at cautious optimism. Markets might be discounting the stock despite its history of profit growth, which could create a potentially attractive entry point for value-focused investors.
Result: Fair Value of ¥8,105.7 (UNDERVALUED)
See our latest analysis for Fukuoka Financial Group.However, risks remain if market sentiment sours or if earnings growth stalls, as either could quickly reverse recent share price gains.
Find out about the key risks to this Fukuoka Financial Group narrative.Another View: The SWS DCF Model Speaks
Taking a different approach, the SWS DCF model also points to the stock being undervalued. This reinforces the message from the earlier comparison. But can two methods really tell the same story, or is something still missing?
Look into how the SWS DCF model arrives at its fair value.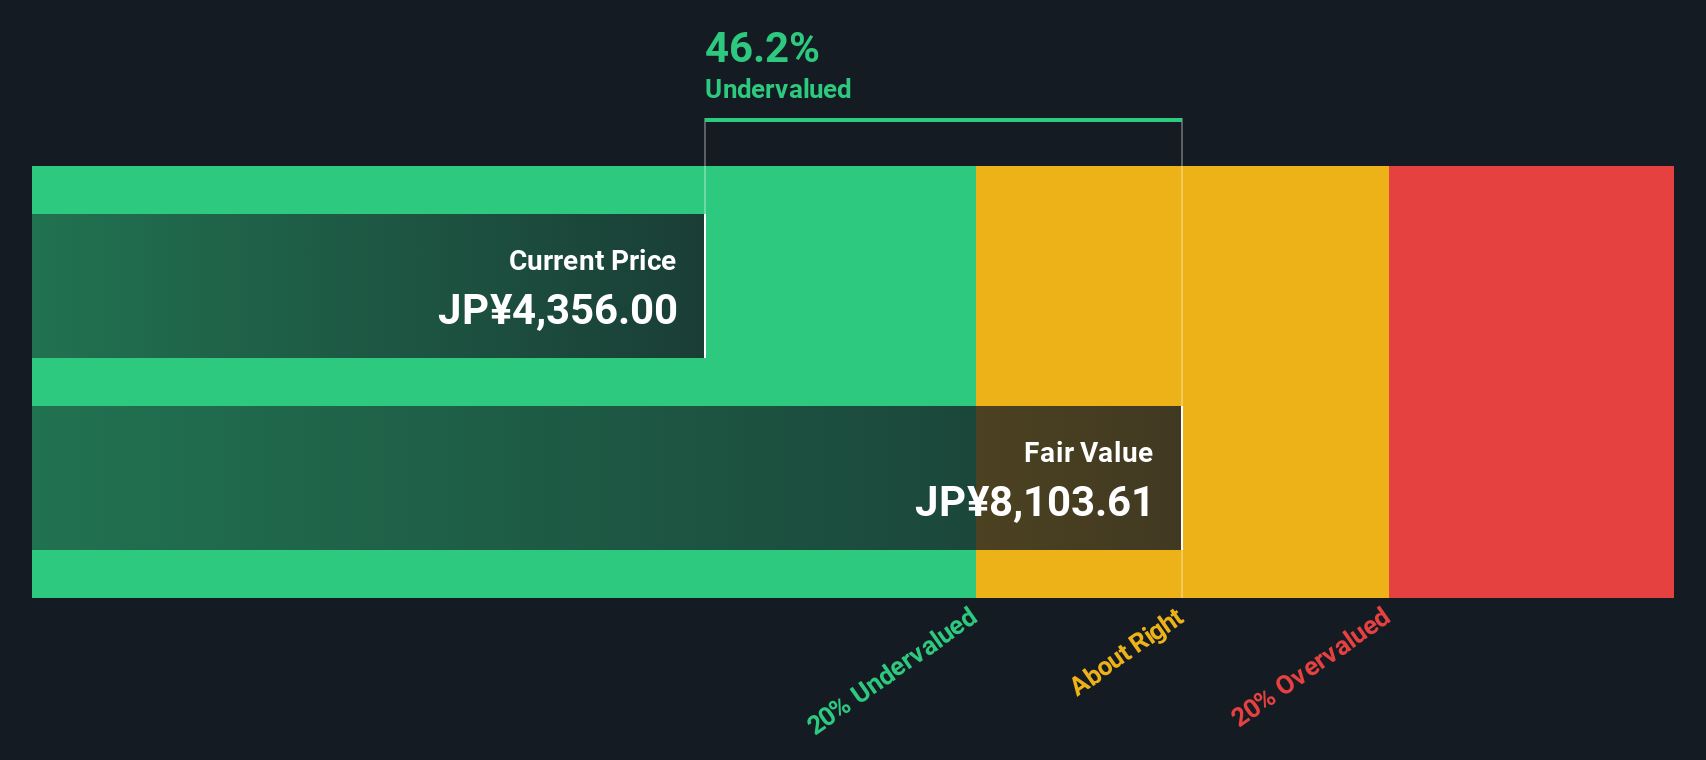
Build Your Own Fukuoka Financial Group Narrative
If this perspective differs from your own or you’d rather reach your own conclusions, it only takes a few minutes to build your personal take on Fukuoka Financial Group. Do it your way.
A great starting point for your Fukuoka Financial Group research is our analysis highlighting 5 key rewards and 1 important warning sign that could impact your investment decision.
Looking for more investment ideas?
Don't wait on opportunity. Fuel your investment journey by tapping into new themes with the Simply Wall Street Screener and uncover stock ideas you might regret missing.
- Tap into companies shaping tomorrow’s connected world with AI breakthroughs by checking out AI penny stocks.
- Target high-yielding stocks and boost your income with options screened for strong dividend payouts through dividend stocks with yields > 3%.
- Catch undervalued opportunities primed for growth before the crowd moves in by using undervalued stocks based on cash flows.
This article by Simply Wall St is general in nature. We provide commentary based on historical data and analyst forecasts only using an unbiased methodology and our articles are not intended to be financial advice. It does not constitute a recommendation to buy or sell any stock, and does not take account of your objectives, or your financial situation. We aim to bring you long-term focused analysis driven by fundamental data. Note that our analysis may not factor in the latest price-sensitive company announcements or qualitative material. Simply Wall St has no position in any stocks mentioned.
New: AI Stock Screener & Alerts
Our new AI Stock Screener scans the market every day to uncover opportunities.
• Dividend Powerhouses (3%+ Yield)
• Undervalued Small Caps with Insider Buying
• High growth Tech and AI Companies
Or build your own from over 50 metrics.
Have feedback on this article? Concerned about the content? Get in touch with us directly. Alternatively, email editorial-team@simplywallst.com
About TSE:8354
Fukuoka Financial Group
Provides various banking services to individual and corporate customers.
Undervalued established dividend payer.
Similar Companies
Market Insights

Advertisement
Community Narratives
Quality at a Premium. A time to watch, not to buy?
Fair Value US$154.56|29.9% undervalued
DA
Community Contributor
GRAB: The Super-App at the Heart of Southeast Asia’s Digital Boom
Fair Value US$8.20|22.9% undervalued
BL
Community Contributor
Verve Group to Surge with 51.61% Revenue Growth
Fair Value €6.00|64.1% undervalued
ME
Community Contributor