
Advertisement
Shizuoka Financial GroupInc's (TSE:5831) five-year earnings growth trails the strong shareholder returns

The worst result, after buying shares in a company (assuming no leverage), would be if you lose all the money you put in. But on the bright side, if you buy shares in a high quality company at the right price, you can gain well over 100%. One great example is Shizuoka Financial Group,Inc. (TSE:5831) which saw its share price drive 152% higher over five years. Also pleasing for shareholders was the 15% gain in the last three months.
On the back of a solid 7-day performance, let's check what role the company's fundamentals have played in driving long term shareholder returns.
We check all companies for important risks. See what we found for Shizuoka Financial GroupInc in our free report.In his essay The Superinvestors of Graham-and-Doddsville Warren Buffett described how share prices do not always rationally reflect the value of a business. One imperfect but simple way to consider how the market perception of a company has shifted is to compare the change in the earnings per share (EPS) with the share price movement.
Over half a decade, Shizuoka Financial GroupInc managed to grow its earnings per share at 12% a year. This EPS growth is slower than the share price growth of 20% per year, over the same period. So it's fair to assume the market has a higher opinion of the business than it did five years ago. That's not necessarily surprising considering the five-year track record of earnings growth.
The graphic below depicts how EPS has changed over time (unveil the exact values by clicking on the image).
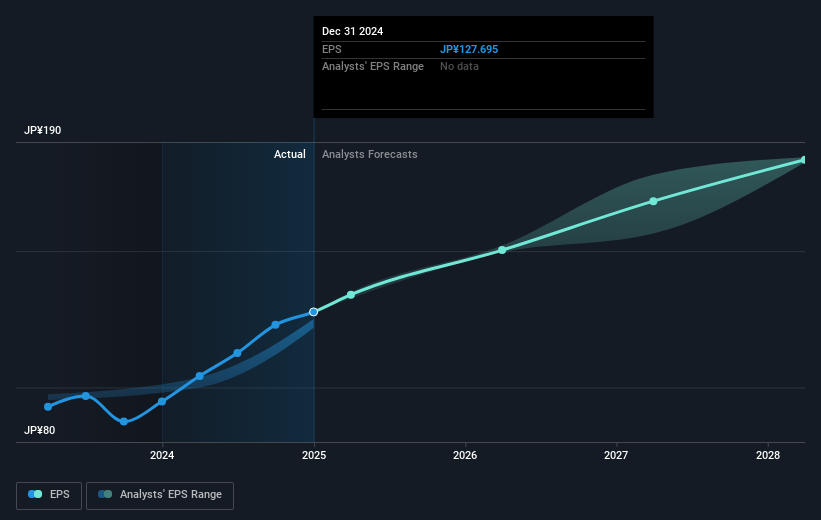
We know that Shizuoka Financial GroupInc has improved its bottom line lately, but is it going to grow revenue? You could check out this free report showing analyst revenue forecasts.
What About Dividends?
It is important to consider the total shareholder return, as well as the share price return, for any given stock. Whereas the share price return only reflects the change in the share price, the TSR includes the value of dividends (assuming they were reinvested) and the benefit of any discounted capital raising or spin-off. It's fair to say that the TSR gives a more complete picture for stocks that pay a dividend. We note that for Shizuoka Financial GroupInc the TSR over the last 5 years was 195%, which is better than the share price return mentioned above. And there's no prize for guessing that the dividend payments largely explain the divergence!
A Different Perspective
It's nice to see that Shizuoka Financial GroupInc shareholders have received a total shareholder return of 10% over the last year. And that does include the dividend. However, the TSR over five years, coming in at 24% per year, is even more impressive. Potential buyers might understandably feel they've missed the opportunity, but it's always possible business is still firing on all cylinders. Importantly, we haven't analysed Shizuoka Financial GroupInc's dividend history. This free visual report on its dividends is a must-read if you're thinking of buying.
Of course, you might find a fantastic investment by looking elsewhere. So take a peek at this free list of companies we expect will grow earnings.
Please note, the market returns quoted in this article reflect the market weighted average returns of stocks that currently trade on Japanese exchanges.
New: Manage All Your Stock Portfolios in One Place
We've created the ultimate portfolio companion for stock investors, and it's free.
• Connect an unlimited number of Portfolios and see your total in one currency
• Be alerted to new Warning Signs or Risks via email or mobile
• Track the Fair Value of your stocks
Have feedback on this article? Concerned about the content? Get in touch with us directly. Alternatively, email editorial-team (at) simplywallst.com.
This article by Simply Wall St is general in nature. We provide commentary based on historical data and analyst forecasts only using an unbiased methodology and our articles are not intended to be financial advice. It does not constitute a recommendation to buy or sell any stock, and does not take account of your objectives, or your financial situation. We aim to bring you long-term focused analysis driven by fundamental data. Note that our analysis may not factor in the latest price-sensitive company announcements or qualitative material. Simply Wall St has no position in any stocks mentioned.
About TSE:5831
Shizuoka Financial GroupInc
Provides various banking products and services.
Solid track record with excellent balance sheet and pays a dividend.
Similar Companies
Market Insights

Advertisement
Community Narratives
Scaling up in building materials with smart M&A and growing profitability
Fair Value US$2.77|28.9% undervalued
CM
Community Contributor
Hims: The Platform Powering Personalised Healthcare
Fair Value US$114.01|46.3% undervalued
BL
Community Contributor
Undervalued lottery company with strong fundamentals
Fair Value AU$15.00|35.8% undervalued
RO
Community Contributor
Proximus, transferring money from the impatient to the patient investor
Fair Value €16.62|56.1% undervalued
AX
Community Contributor