- Japan
- /
- Auto Components
- /
- TSE:5334
Top Dividend Stocks To Watch In January 2025

Reviewed by Simply Wall St

As global markets navigate a landscape of easing inflation and robust bank earnings, major U.S. stock indexes have rebounded strongly, with value stocks notably outpacing growth shares amid rising oil prices and profit-taking in large-cap technology stocks. In this environment, dividend stocks can offer investors a blend of income stability and potential capital appreciation, making them an attractive option to consider as part of a diversified portfolio.
Top 10 Dividend Stocks
| Name | Dividend Yield | Dividend Rating |
| Financial Institutions (NasdaqGS:FISI) | 4.45% | ★★★★★★ |
| Tsubakimoto Chain (TSE:6371) | 4.29% | ★★★★★★ |
| Guaranty Trust Holding (NGSE:GTCO) | 6.17% | ★★★★★★ |
| Peoples Bancorp (NasdaqGS:PEBO) | 4.97% | ★★★★★★ |
| CAC Holdings (TSE:4725) | 4.68% | ★★★★★★ |
| Southside Bancshares (NYSE:SBSI) | 4.53% | ★★★★★★ |
| Padma Oil (DSE:PADMAOIL) | 7.49% | ★★★★★★ |
| Premier Financial (NasdaqGS:PFC) | 4.91% | ★★★★★★ |
| E J Holdings (TSE:2153) | 4.09% | ★★★★★★ |
| Citizens & Northern (NasdaqCM:CZNC) | 5.91% | ★★★★★★ |
Click here to see the full list of 1981 stocks from our Top Dividend Stocks screener.
We'll examine a selection from our screener results.
Ashimori Industry (TSE:3526)
Simply Wall St Dividend Rating: ★★★★☆☆
Overview: Ashimori Industry Co., Ltd. manufactures and sells automotive safety systems both in Japan and internationally, with a market capitalization of ¥16.05 billion.
Operations: Ashimori Industry Co., Ltd. generates revenue from two primary segments: the Automotive Safety Parts Business, which contributes ¥51.79 billion, and the Functional Product Business, which adds ¥19.91 billion.
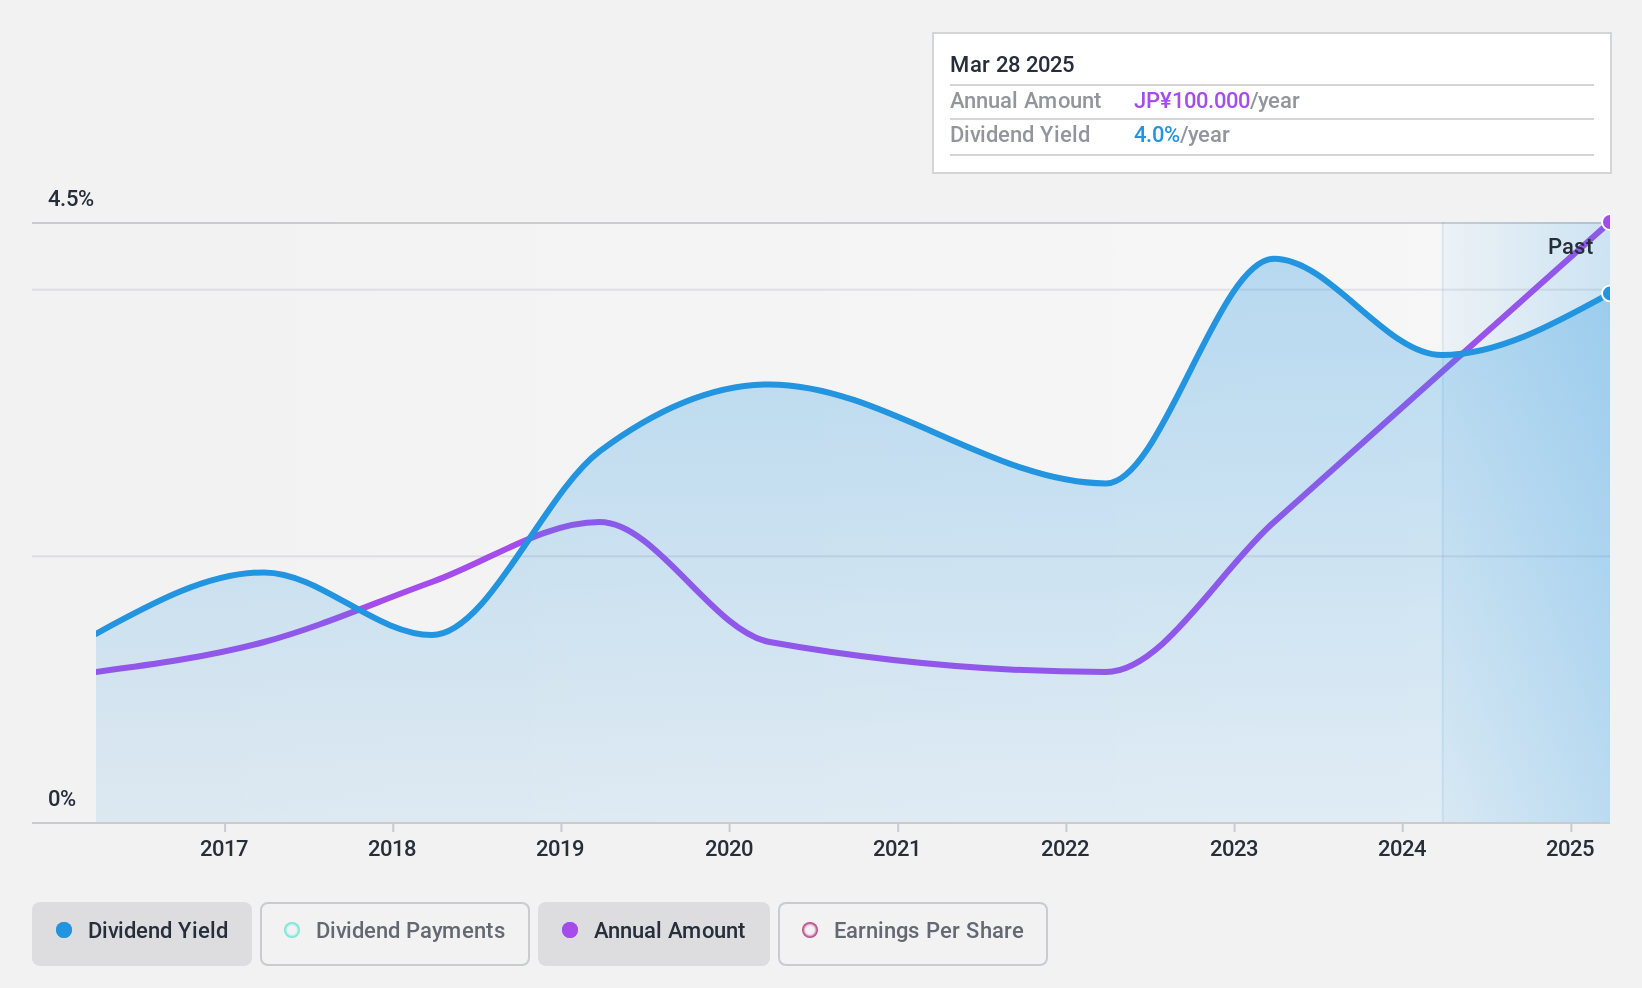
Dividend Yield: 3.7%
Ashimori Industry's dividend payments are well covered by both earnings and cash flows, with payout ratios of 27.3% and 25.7%, respectively. Despite a strong recent earnings growth of 72.4%, the company's dividends have been volatile and unreliable over the past decade, with significant annual drops exceeding 20%. The price-to-earnings ratio of 7.5x suggests good value compared to the broader Japanese market average of 13.5x, though its dividend yield is slightly below top-tier levels in Japan at 3.66%.
- Navigate through the intricacies of Ashimori Industry with our comprehensive dividend report here.
- The valuation report we've compiled suggests that Ashimori Industry's current price could be inflated.
Niterra (TSE:5334)
Simply Wall St Dividend Rating: ★★★★☆☆
Overview: Niterra Co., Ltd. manufactures and sells spark plugs and related products for internal-combustion engines, as well as technical ceramics, operating both in Japan and internationally, with a market cap of ¥981.67 billion.
Operations: Niterra Co., Ltd.'s revenue segments include Automobile Connection, generating ¥527.37 billion, and Ceramic (including Medical-Related), contributing ¥97.70 billion.
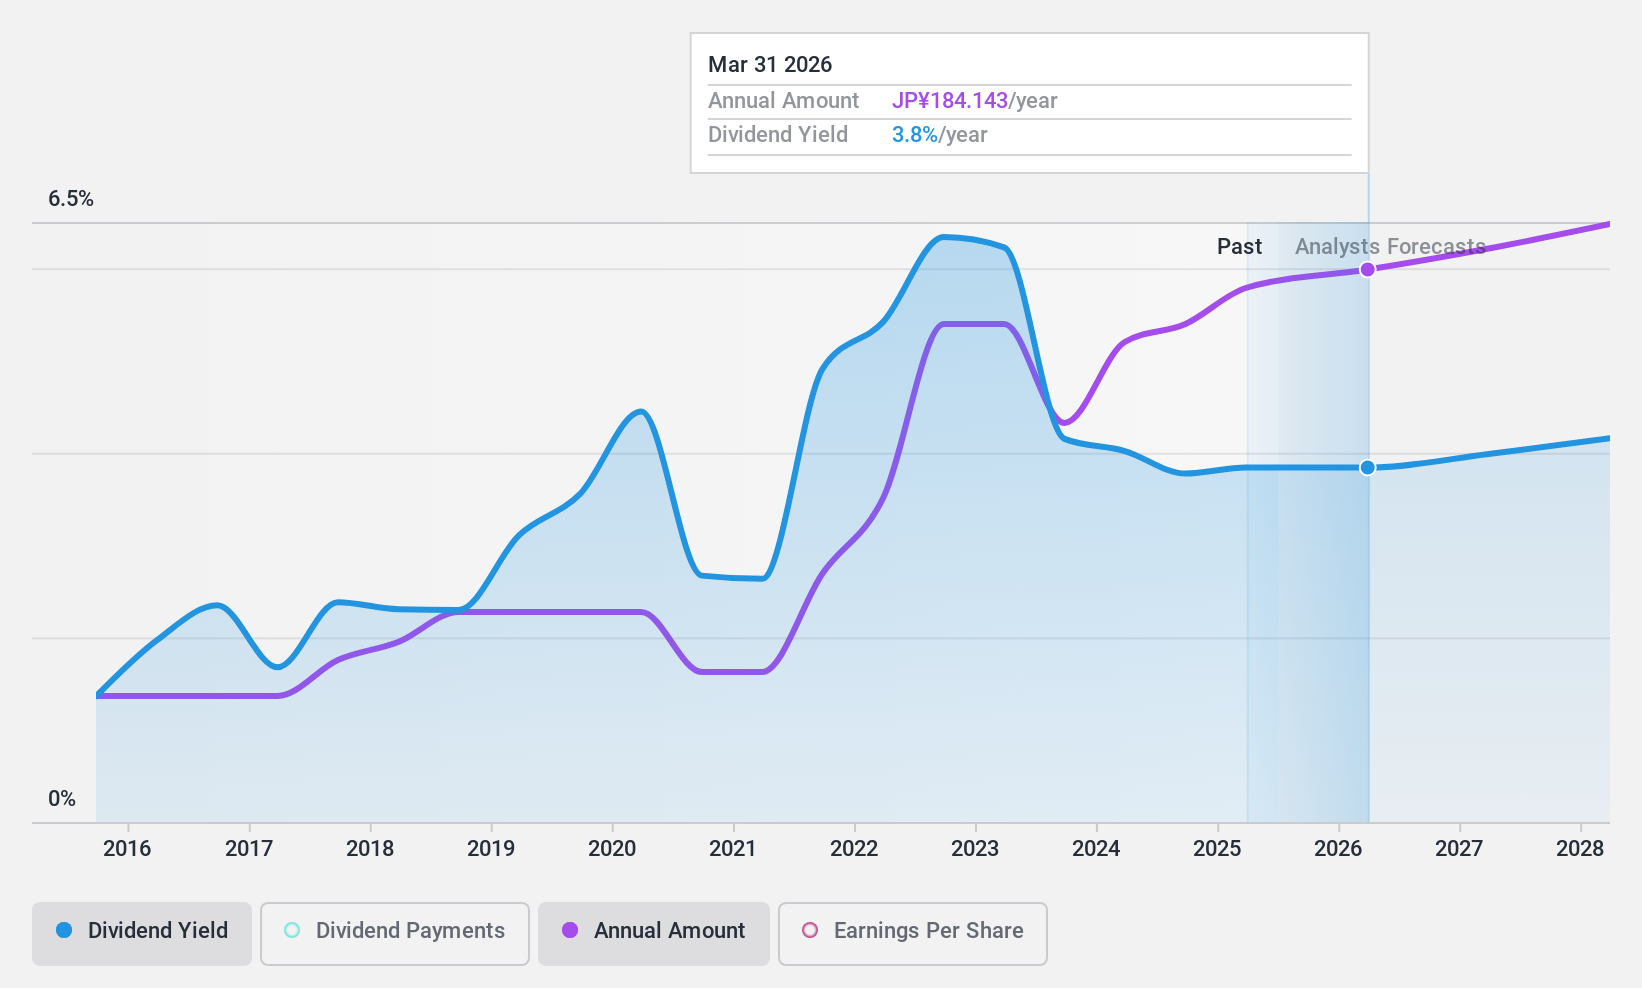
Dividend Yield: 3.6%
Niterra's dividend payments are well supported by earnings and cash flows, with payout ratios of 39.6% and 35.8%, respectively. Despite a recent earnings growth of 25.2%, the dividends have been volatile over the past decade, experiencing significant drops at times, making them unreliable. Trading at 34% below its estimated fair value indicates potential undervaluation, though its dividend yield of 3.57% remains lower than top-tier Japanese payers at 3.82%.
- Click here and access our complete dividend analysis report to understand the dynamics of Niterra.
- Our comprehensive valuation report raises the possibility that Niterra is priced lower than what may be justified by its financials.
I-Net (TSE:9600)
Simply Wall St Dividend Rating: ★★★★☆☆
Overview: I-Net Corp. engages in information processing and system development services, as well as selling system equipment, with a market cap of ¥23.73 billion.
Operations: I-Net Corp.'s revenue is primarily derived from its Information Service Business, which generated ¥37.66 billion.
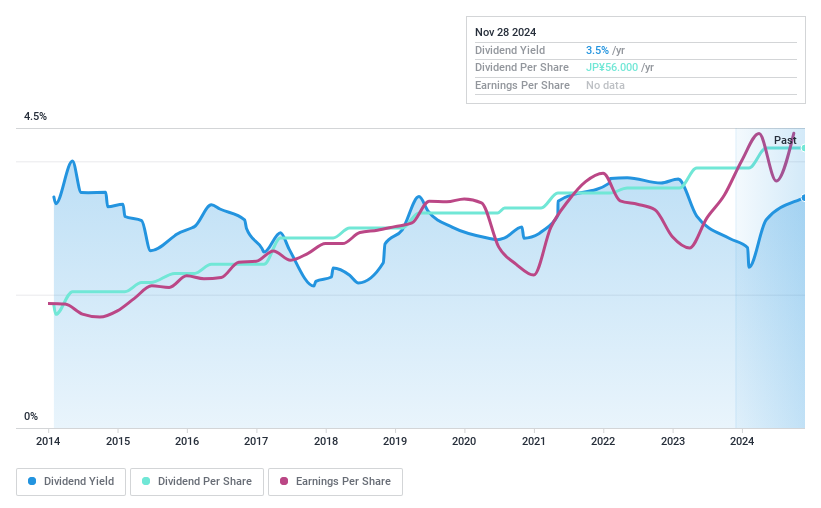
Dividend Yield: 3.6%
I-Net's dividend payments are well supported by earnings, with a payout ratio of 40%, but not by cash flows due to a high cash payout ratio of 110.1%. The dividend yield of 3.57% is below the top tier in Japan (3.82%). Dividends have been stable and growing over the past decade, yet large one-off items affect earnings quality. The price-to-earnings ratio is favorable at 11.1x compared to the market average of 13.5x.
- Click here to discover the nuances of I-Net with our detailed analytical dividend report.
- Our expertly prepared valuation report I-Net implies its share price may be too high.
Key Takeaways
- Delve into our full catalog of 1981 Top Dividend Stocks here.
- Are these companies part of your investment strategy? Use Simply Wall St to consolidate your holdings into a portfolio and gain insights with our comprehensive analysis tools.
- Invest smarter with the free Simply Wall St app providing detailed insights into every stock market around the globe.
Interested In Other Possibilities?
- Explore high-performing small cap companies that haven't yet garnered significant analyst attention.
- Fuel your portfolio with companies showing strong growth potential, backed by optimistic outlooks both from analysts and management.
- Find companies with promising cash flow potential yet trading below their fair value.
This article by Simply Wall St is general in nature. We provide commentary based on historical data and analyst forecasts only using an unbiased methodology and our articles are not intended to be financial advice. It does not constitute a recommendation to buy or sell any stock, and does not take account of your objectives, or your financial situation. We aim to bring you long-term focused analysis driven by fundamental data. Note that our analysis may not factor in the latest price-sensitive company announcements or qualitative material. Simply Wall St has no position in any stocks mentioned.
Valuation is complex, but we're here to simplify it.
Discover if Niterra might be undervalued or overvalued with our detailed analysis, featuring fair value estimates, potential risks, dividends, insider trades, and its financial condition.
Access Free AnalysisHave feedback on this article? Concerned about the content? Get in touch with us directly. Alternatively, email editorial-team@simplywallst.com
About TSE:5334
Niterra
Manufactures and sells spark plugs and related products for internal-combustion engines and technical ceramics in Japan and internationally.
Flawless balance sheet with solid track record and pays a dividend.
