Maps S.p.A. (BIT:MAPS), is not the largest company out there, but it saw a significant share price rise of over 20% in the past couple of months on the BIT. As a small cap stock, hardly covered by any analysts, there is generally more of an opportunity for mispricing as there is less activity to push the stock closer to fair value. Is there still an opportunity here to buy? Let’s take a look at Maps’s outlook and value based on the most recent financial data to see if the opportunity still exists.
View our latest analysis for Maps
What's the opportunity in Maps?
Maps appears to be expensive according to my price multiple model, which makes a comparison between the company's price-to-earnings ratio and the industry average. In this instance, I’ve used the price-to-earnings (PE) ratio given that there is not enough information to reliably forecast the stock’s cash flows. I find that Maps’s ratio of 31.64x is above its peer average of 26.46x, which suggests the stock is trading at a higher price compared to the Software industry. But, is there another opportunity to buy low in the future? Given that Maps’s share is fairly volatile (i.e. its price movements are magnified relative to the rest of the market) this could mean the price can sink lower, giving us another chance to buy in the future. This is based on its high beta, which is a good indicator for share price volatility.
What kind of growth will Maps generate?

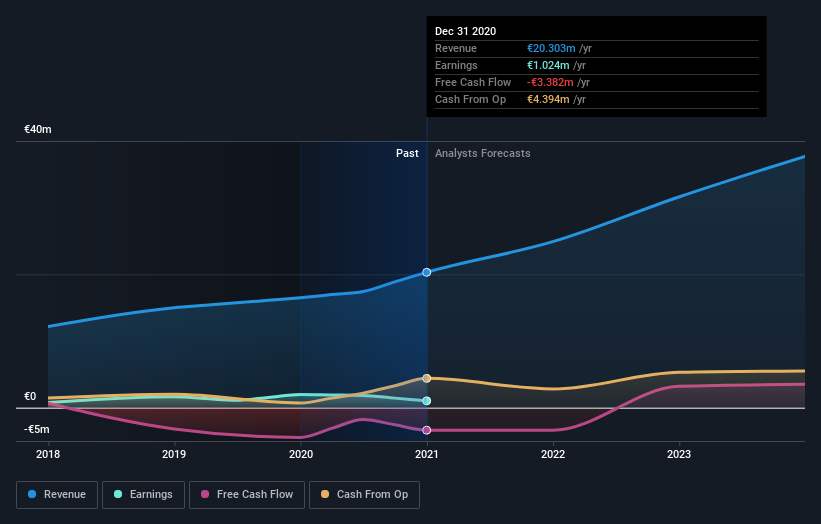
Future outlook is an important aspect when you’re looking at buying a stock, especially if you are an investor looking for growth in your portfolio. Although value investors would argue that it’s the intrinsic value relative to the price that matter the most, a more compelling investment thesis would be high growth potential at a cheap price. In Maps' case, its revenues over the next few years are expected to grow by 86%, indicating a highly optimistic future ahead. If expense does not increase by the same rate, or higher, this top line growth should lead to stronger cash flows, feeding into a higher share value.
What this means for you:
Are you a shareholder? It seems like the market has well and truly priced in MAPS’s positive outlook, with shares trading above industry price multiples. However, this brings up another question – is now the right time to sell? If you believe MAPS should trade below its current price, selling high and buying it back up again when its price falls towards the industry PE ratio can be profitable. But before you make this decision, take a look at whether its fundamentals have changed.
Are you a potential investor? If you’ve been keeping tabs on MAPS for some time, now may not be the best time to enter into the stock. The price has surpassed its industry peers, which means it is likely that there is no more upside from mispricing. However, the optimistic prospect is encouraging for MAPS, which means it’s worth diving deeper into other factors in order to take advantage of the next price drop.
If you'd like to know more about Maps as a business, it's important to be aware of any risks it's facing. For instance, we've identified 7 warning signs for Maps (1 shouldn't be ignored) you should be familiar with.
If you are no longer interested in Maps, you can use our free platform to see our list of over 50 other stocks with a high growth potential.
If you decide to trade Maps, use the lowest-cost* platform that is rated #1 Overall by Barron’s, Interactive Brokers. Trade stocks, options, futures, forex, bonds and funds on 135 markets, all from a single integrated account. Promoted
Mobile Infrastructure for Defense and Disaster
The next wave in robotics isn't humanoid. Its fully autonomous towers delivering 5G, ISR, and radar in under 30 minutes, anywhere.
Get the investor briefing before the next round of contracts
Sponsored On Behalf of CiTechNew: Manage All Your Stock Portfolios in One Place
We've created the ultimate portfolio companion for stock investors, and it's free.
• Connect an unlimited number of Portfolios and see your total in one currency
• Be alerted to new Warning Signs or Risks via email or mobile
• Track the Fair Value of your stocks
This article by Simply Wall St is general in nature. It does not constitute a recommendation to buy or sell any stock, and does not take account of your objectives, or your financial situation. We aim to bring you long-term focused analysis driven by fundamental data. Note that our analysis may not factor in the latest price-sensitive company announcements or qualitative material. Simply Wall St has no position in any stocks mentioned.
*Interactive Brokers Rated Lowest Cost Broker by StockBrokers.com Annual Online Review 2020
Have feedback on this article? Concerned about the content? Get in touch with us directly. Alternatively, email editorial-team (at) simplywallst.com.
About BIT:MAPS
Maps
A software solution provider, designs and develops technological solutions to support decision-making processes in public and private businesses and organizations.
Flawless balance sheet and undervalued.
Market Insights
Weekly Picks

THE KINGDOM OF BROWN GOODS: WHY MGPI IS BEING CRUSHED BY INVENTORY & PRIMED FOR RESURRECTION


Why Vertical Aerospace (NYSE: EVTL) is Worth Possibly Over 13x its Current Price


The Quiet Giant That Became AI’s Power Grid
Recently Updated Narratives


MINISO's fair value is projected at 26.69 with an anticipated PE ratio shift of 20x


Fiverr International will transform the freelance industry with AI-powered growth

Stride Stock: Online Education Finds Its Second Act
Popular Narratives


MicroVision will explode future revenue by 380.37% with a vision towards success


Crazy Undervalued 42 Baggers Silver Play (Active & Running Mine)


