
While Maps S.p.A. (BIT:MAPS) might not be the most widely known stock at the moment, it received a lot of attention from a substantial price movement on the BIT over the last few months, increasing to €2.58 at one point, and dropping to the lows of €2.15. Some share price movements can give investors a better opportunity to enter into the stock, and potentially buy at a lower price. A question to answer is whether Maps' current trading price of €2.23 reflective of the actual value of the small-cap? Or is it currently undervalued, providing us with the opportunity to buy? Let’s take a look at Maps’s outlook and value based on the most recent financial data to see if there are any catalysts for a price change.
Check out our latest analysis for Maps
Is Maps still cheap?
Good news, investors! Maps is still a bargain right now according to my price multiple model, which compares the company's price-to-earnings ratio to the industry average. I’ve used the price-to-earnings ratio in this instance because there’s not enough visibility to forecast its cash flows. The stock’s ratio of 10.34x is currently well-below the industry average of 42.71x, meaning that it is trading at a cheaper price relative to its peers. What’s more interesting is that, Maps’s share price is quite volatile, which gives us more chances to buy since the share price could sink lower (or rise higher) in the future. This is based on its high beta, which is a good indicator for how much the stock moves relative to the rest of the market.
Can we expect growth from Maps?
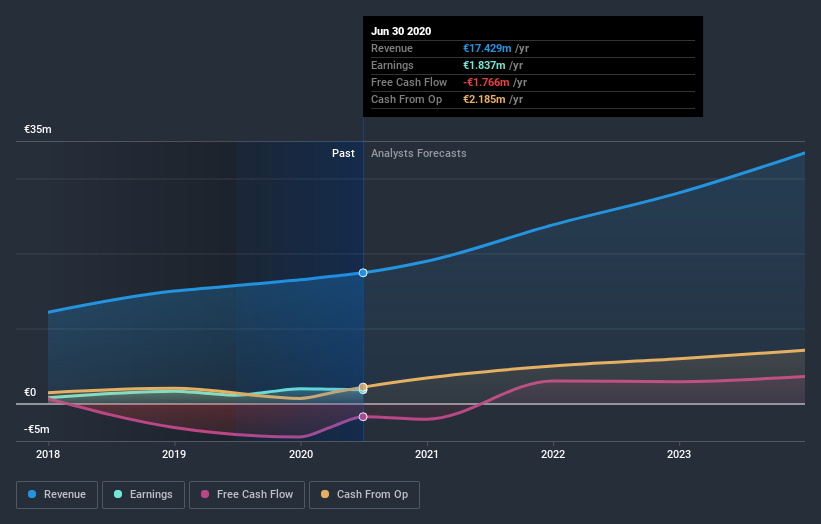
Future outlook is an important aspect when you’re looking at buying a stock, especially if you are an investor looking for growth in your portfolio. Buying a great company with a robust outlook at a cheap price is always a good investment, so let’s also take a look at the company's future expectations. In Maps' case, its revenues over the next few years are expected to grow by 76%, indicating a highly optimistic future ahead. If expense does not increase by the same rate, or higher, this top line growth should lead to stronger cash flows, feeding into a higher share value.
What this means for you:
Are you a shareholder? Since MAPS is currently trading below the industry PE ratio, it may be a great time to accumulate more of your holdings in the stock. With an optimistic outlook on the horizon, it seems like this growth has not yet been fully factored into the share price. However, there are also other factors such as financial health to consider, which could explain the current price multiple.
Are you a potential investor? If you’ve been keeping an eye on MAPS for a while, now might be the time to make a leap. Its buoyant future outlook isn’t fully reflected in the current share price yet, which means it’s not too late to buy MAPS. But before you make any investment decisions, consider other factors such as the strength of its balance sheet, in order to make a well-informed investment decision.
If you'd like to know more about Maps as a business, it's important to be aware of any risks it's facing. Be aware that Maps is showing 4 warning signs in our investment analysis and 1 of those is a bit unpleasant...
If you are no longer interested in Maps, you can use our free platform to see our list of over 50 other stocks with a high growth potential.
If you’re looking to trade Maps, open an account with the lowest-cost* platform trusted by professionals, Interactive Brokers. Their clients from over 200 countries and territories trade stocks, options, futures, forex, bonds and funds worldwide from a single integrated account. Promoted
The New Payments ETF Is Live on NASDAQ:
Money is moving to real-time rails, and a newly listed ETF now gives investors direct exposure. Fast settlement. Institutional custody. Simple access.
Explore how this launch could reshape portfolios
Sponsored ContentNew: Manage All Your Stock Portfolios in One Place
We've created the ultimate portfolio companion for stock investors, and it's free.
• Connect an unlimited number of Portfolios and see your total in one currency
• Be alerted to new Warning Signs or Risks via email or mobile
• Track the Fair Value of your stocks
This article by Simply Wall St is general in nature. It does not constitute a recommendation to buy or sell any stock, and does not take account of your objectives, or your financial situation. We aim to bring you long-term focused analysis driven by fundamental data. Note that our analysis may not factor in the latest price-sensitive company announcements or qualitative material. Simply Wall St has no position in any stocks mentioned.
*Interactive Brokers Rated Lowest Cost Broker by StockBrokers.com Annual Online Review 2020
Have feedback on this article? Concerned about the content? Get in touch with us directly. Alternatively, email editorial-team (at) simplywallst.com.
About BIT:MAPS
Maps
A software solution provider, designs and develops technological solutions to support decision-making processes in public and private businesses and organizations.
Flawless balance sheet and undervalued.
Market Insights

Weekly Picks

THE KINGDOM OF BROWN GOODS: WHY MGPI IS BEING CRUSHED BY INVENTORY & PRIMED FOR RESURRECTION


Why Vertical Aerospace (NYSE: EVTL) is Worth Possibly Over 13x its Current Price


The Quiet Giant That Became AI’s Power Grid
Recently Updated Narratives

Jackson Financial Stock: When Insurance Math Meets a Shifting Claims Landscape

Stride Stock: Online Education Finds Its Second Act

CS Disco Stock: Legal AI Is Moving From Efficiency Tool to Competitive Necessity
Popular Narratives


MicroVision will explode future revenue by 380.37% with a vision towards success


Crazy Undervalued 42 Baggers Silver Play (Active & Running Mine)


