- Italy
- /
- Diversified Financial
- /
- BIT:NEXI
Weighing Nexi’s Value After Five Year 70% Slide and M&A Speculation in 2025

Reviewed by Simply Wall St
So, you are eyeing Nexi stock and wondering where it stands, either as an opportunity to buy on the dip or as a cautionary tale of catching a falling knife. To be fair, the last five years have not been particularly kind to Nexi shareholders, with the stock down a hefty 70.4% in that timeframe. Even in the last year alone, Nexi has declined by 19.8%, and so far this year it is still down about 11.7%. If you zoom in a bit closer, the picture is more nuanced: while last week brought a modest gain of 2.2%, over the last month the shares took another slide with a 14.8% drop.
Some of this volatility has been shaped by broader market anxiety around European fintech companies. Shifting rates and changes in payment sector regulation have kept investors on edge, not to mention ongoing speculation around merger activity across the industry. While the longer-term numbers tell a story of heavy losses, shorter bursts of price action suggest occasional bursts of optimism. However, these are yet to turn the ship around.
If you are considering Nexi, you are probably asking whether the current price reflects genuine value or simply the market’s reduced expectations. Here is where the valuation check comes in. Based on six commonly used valuation benchmarks, Nexi scores just 1 out of 6 for being undervalued at its current share price. Yet, that is just scratching the surface, because the finer points of valuation, and perhaps something even better, are up next.
Nexi scores just 1/6 on our valuation checks. See what other red flags we found in the full valuation breakdown.Approach 1: Nexi Excess Returns Analysis
The Excess Returns model evaluates whether a company generates returns on its equity above or below what investors require for the risk they are taking. In simple terms, it measures the value a business creates compared to what shareholders could expect from a typical investment, after factoring in the company's cost of equity and growth outlook.
For Nexi, the key inputs to this model include a Book Value of €8.86 per share and a Stable Earnings Per Share (EPS) of €0.72, which is based on weighted future Return on Equity estimates from nine analysts. The average Return on Equity (ROE) sits at 7.37%. Nexi’s cost of equity is €1.37 per share, resulting in an excess return of €-0.65 per share. Analysts forecast a gradual rise in book value, with a stable estimate of €9.76 per share derived from seven analysts' future projections.
Combining all these factors, the Excess Returns model calculates Nexi’s intrinsic value at €3.94 per share. With the stock currently trading around 20.8% higher than this estimate, the implication is that the shares are overvalued based on the returns they generate compared to their cost of capital.
Result: OVERVALUED
Head to the Valuation section of our Company Report for more details on how we arrive at this Fair Value for Nexi.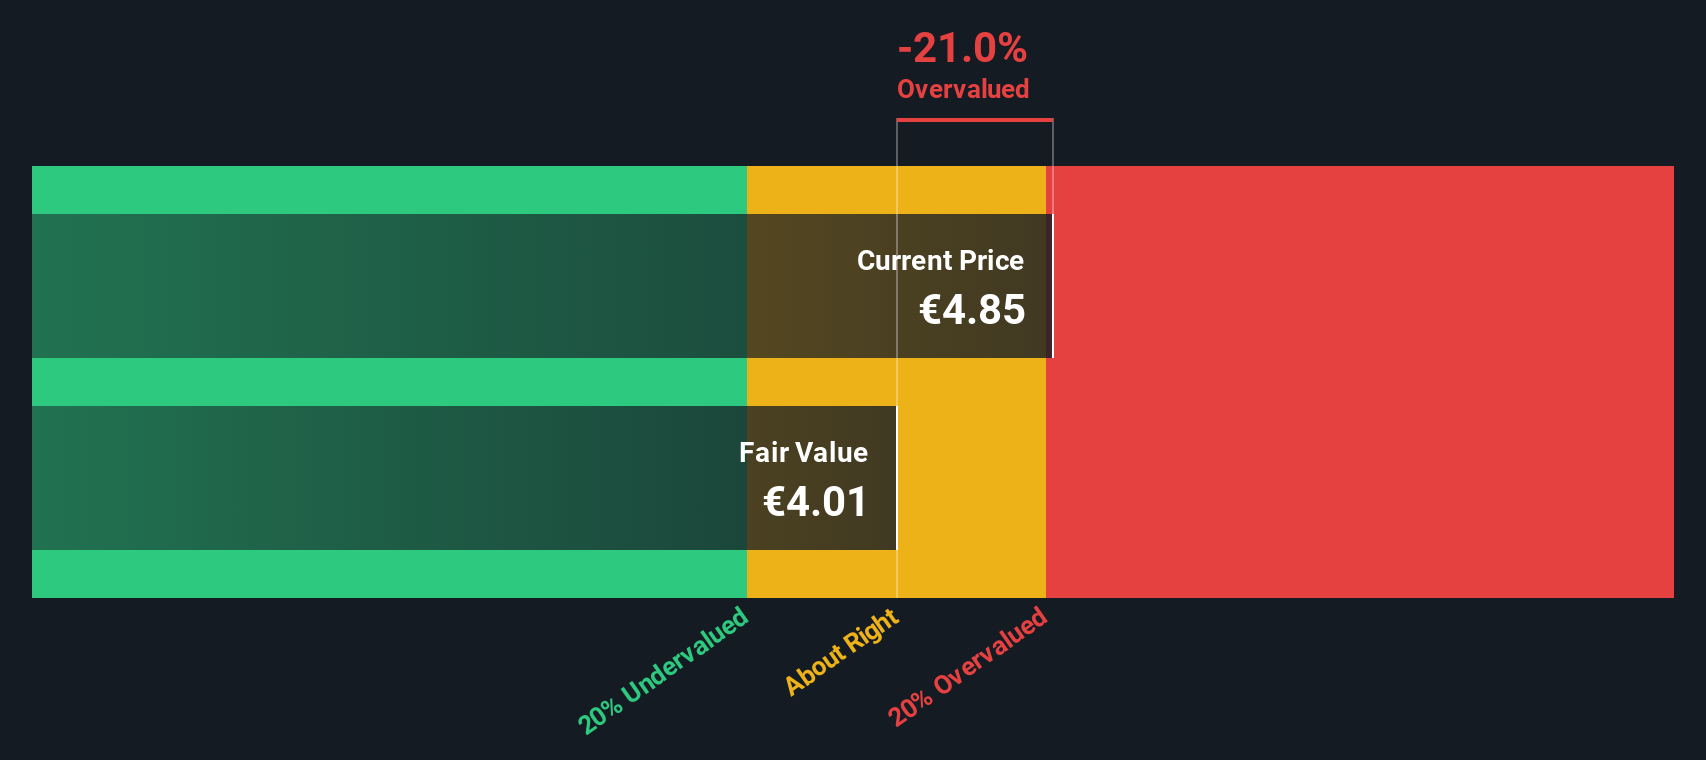
Approach 2: Nexi Price vs Earnings
For profitable companies like Nexi, the Price-to-Earnings (PE) ratio is a widely used tool to gauge how the stock is valued relative to its earnings power. It is especially suitable in this context because Nexi generates consistent profits, making the earnings figure both meaningful and comparable over time.
The "right" PE ratio can differ between companies and industries. Factors such as a company’s expected growth, perceived risk, and overall profitability all play a part in deciding how much investors are willing to pay for €1 of earnings. Higher growth or lower risk typically justifies a higher PE, while riskier or slower-growing firms often trade at lower multiples.
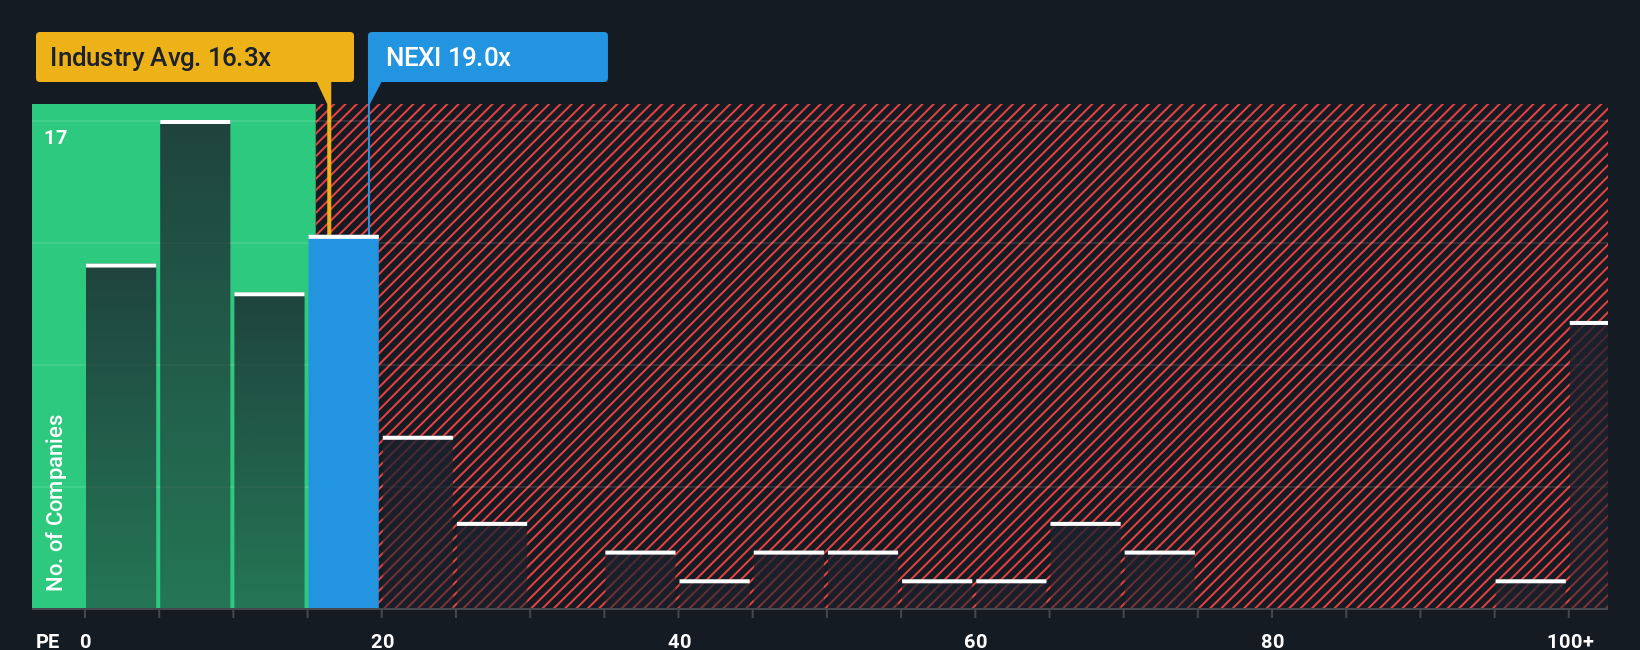
Currently, Nexi trades at a PE ratio of 18.7x, which is higher than the Diversified Financial industry average of 15.9x and above its peer group’s average of 12.6x. However, a better benchmark is Simply Wall St’s proprietary "Fair Ratio," which estimates what the company’s PE should be when factoring in its growth, profit margins, risks, industry conditions, and market cap. Nexi’s Fair Ratio is 24.0x. This figure offers a more holistic view than simply comparing industry or peer averages, as it recognizes nuances unique to Nexi and its operating environment. With Nexi’s current PE at 18.7x compared to a Fair Ratio of 24.0x, the stock appears undervalued using this approach.
Result: UNDERVALUED
Upgrade Your Decision Making: Choose your Nexi Narrative
Earlier, we mentioned there is an even better way to understand valuation, so let us introduce you to Narratives. A Narrative is simply your story about a company, combining your thoughts and expectations about its business with your own estimates of future revenue, profit margins, and a fair value. Narratives are powerful because they connect your unique perspective, whether optimistic or cautious, directly to a financial forecast and valuation. This makes the decision-making process more dynamic and personalized.
On Simply Wall St’s Community page, Narratives are straightforward and accessible, used by millions of investors to help clarify when a stock is fairly valued, undervalued, or overvalued compared to its current price. Narratives update automatically when major news or earnings are released, ensuring your view stays relevant. For Nexi, one investor might believe digital payment growth will drive profits higher and set a target price at €8.75. Another could be concerned about competition or integration risks and view €4.50 as fair value. Narratives let you weigh these differing perspectives and your own, empowering smarter investment decisions grounded in both numbers and real-world context.
Do you think there's more to the story for Nexi? Create your own Narrative to let the Community know!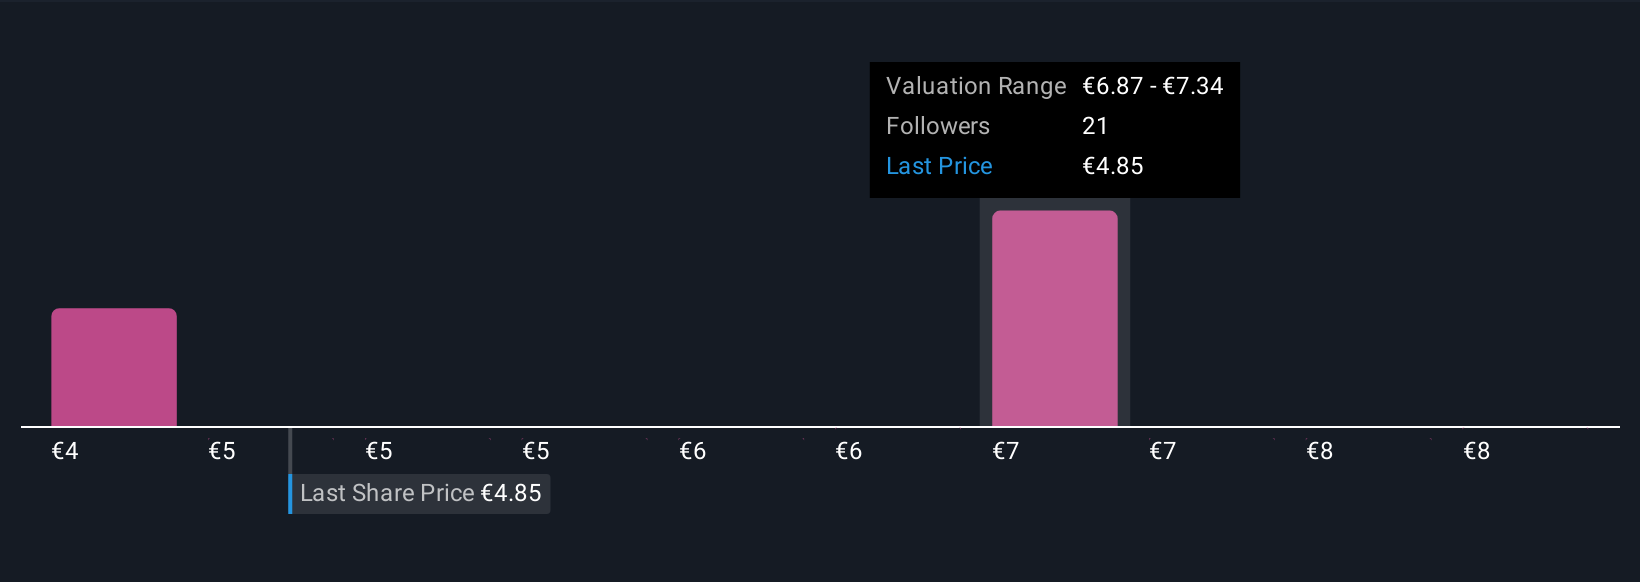
This article by Simply Wall St is general in nature. We provide commentary based on historical data and analyst forecasts only using an unbiased methodology and our articles are not intended to be financial advice. It does not constitute a recommendation to buy or sell any stock, and does not take account of your objectives, or your financial situation. We aim to bring you long-term focused analysis driven by fundamental data. Note that our analysis may not factor in the latest price-sensitive company announcements or qualitative material. Simply Wall St has no position in any stocks mentioned.
The New Payments ETF Is Live on NASDAQ:
Money is moving to real-time rails, and a newly listed ETF now gives investors direct exposure. Fast settlement. Institutional custody. Simple access.
Explore how this launch could reshape portfolios
Sponsored ContentValuation is complex, but we're here to simplify it.
Discover if Nexi might be undervalued or overvalued with our detailed analysis, featuring fair value estimates, potential risks, dividends, insider trades, and its financial condition.
Access Free AnalysisHave feedback on this article? Concerned about the content? Get in touch with us directly. Alternatively, email editorial-team@simplywallst.com
About BIT:NEXI
Nexi
Provides electronic money and payment services to banks, small and medium-sized enterprises, large international corporations, institutions, and public administrations in Italy, Nordics and Baltics, Germany, Austria, Switzerland, Poland, Southeast Europe, and internationally.
Adequate balance sheet with moderate growth potential.
Similar Companies
Market Insights

Weekly Picks

THE KINGDOM OF BROWN GOODS: WHY MGPI IS BEING CRUSHED BY INVENTORY & PRIMED FOR RESURRECTION


Why Vertical Aerospace (NYSE: EVTL) is Worth Possibly Over 13x its Current Price


The Quiet Giant That Became AI’s Power Grid
Recently Updated Narratives


Unicycive Therapeutics (Nasdaq: UNCY) – Preparing for a Second Shot at Bringing a New Kidney Treatment to Market (TEST)

Rocket Lab USA Will Ignite a 30% Revenue Growth Journey


Dollar general to grow
Popular Narratives


MicroVision will explode future revenue by 380.37% with a vision towards success


NVDA: Expanding AI Demand Will Drive Major Data Center Investments Through 2026


