Salvatore Ferragamo (BIT:SFER) stock falls 3.5% in past week as five-year earnings and shareholder returns continue downward trend


Generally speaking long term investing is the way to go. But that doesn't mean long term investors can avoid big losses. For example, after five long years the Salvatore Ferragamo S.p.A. (BIT:SFER) share price is a whole 56% lower. That's an unpleasant experience for long term holders. And it's not just long term holders hurting, because the stock is down 41% in the last year. Furthermore, it's down 22% in about a quarter. That's not much fun for holders.
Since Salvatore Ferragamo has shed €55m from its value in the past 7 days, let's see if the longer term decline has been driven by the business' economics.
See our latest analysis for Salvatore Ferragamo
There is no denying that markets are sometimes efficient, but prices do not always reflect underlying business performance. One imperfect but simple way to consider how the market perception of a company has shifted is to compare the change in the earnings per share (EPS) with the share price movement.
During five years of share price growth, Salvatore Ferragamo moved from a loss to profitability. Most would consider that to be a good thing, so it's counter-intuitive to see the share price declining. Other metrics might give us a better handle on how its value is changing over time.
The modest 1.1% dividend yield is unlikely to be guiding the market view of the stock. The revenue fall of 1.7% per year for five years is neither good nor terrible. But if the market expected durable top line growth, then that could explain the share price weakness.
The image below shows how earnings and revenue have tracked over time (if you click on the image you can see greater detail).
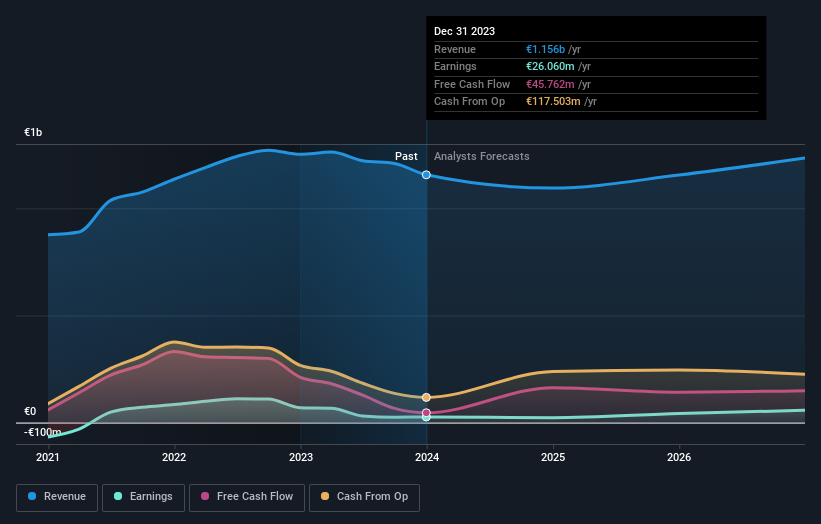
Salvatore Ferragamo is well known by investors, and plenty of clever analysts have tried to predict the future profit levels. So it makes a lot of sense to check out what analysts think Salvatore Ferragamo will earn in the future (free analyst consensus estimates)
What About Dividends?
As well as measuring the share price return, investors should also consider the total shareholder return (TSR). Whereas the share price return only reflects the change in the share price, the TSR includes the value of dividends (assuming they were reinvested) and the benefit of any discounted capital raising or spin-off. Arguably, the TSR gives a more comprehensive picture of the return generated by a stock. We note that for Salvatore Ferragamo the TSR over the last 5 years was -54%, which is better than the share price return mentioned above. The dividends paid by the company have thusly boosted the total shareholder return.
A Different Perspective
Investors in Salvatore Ferragamo had a tough year, with a total loss of 41% (including dividends), against a market gain of about 24%. Even the share prices of good stocks drop sometimes, but we want to see improvements in the fundamental metrics of a business, before getting too interested. Unfortunately, last year's performance may indicate unresolved challenges, given that it was worse than the annualised loss of 9% over the last half decade. Generally speaking long term share price weakness can be a bad sign, though contrarian investors might want to research the stock in hope of a turnaround. It's always interesting to track share price performance over the longer term. But to understand Salvatore Ferragamo better, we need to consider many other factors. For example, we've discovered 2 warning signs for Salvatore Ferragamo that you should be aware of before investing here.
If you like to buy stocks alongside management, then you might just love this free list of companies. (Hint: many of them are unnoticed AND have attractive valuation).
Please note, the market returns quoted in this article reflect the market weighted average returns of stocks that currently trade on Italian exchanges.
If you're looking to trade Salvatore Ferragamo, open an account with the lowest-cost platform trusted by professionals, Interactive Brokers.
With clients in over 200 countries and territories, and access to 160 markets, IBKR lets you trade stocks, options, futures, forex, bonds and funds from a single integrated account.
Enjoy no hidden fees, no account minimums, and FX conversion rates as low as 0.03%, far better than what most brokers offer.
Sponsored ContentNew: Manage All Your Stock Portfolios in One Place
We've created the ultimate portfolio companion for stock investors, and it's free.
• Connect an unlimited number of Portfolios and see your total in one currency
• Be alerted to new Warning Signs or Risks via email or mobile
• Track the Fair Value of your stocks
Have feedback on this article? Concerned about the content? Get in touch with us directly. Alternatively, email editorial-team (at) simplywallst.com.
This article by Simply Wall St is general in nature. We provide commentary based on historical data and analyst forecasts only using an unbiased methodology and our articles are not intended to be financial advice. It does not constitute a recommendation to buy or sell any stock, and does not take account of your objectives, or your financial situation. We aim to bring you long-term focused analysis driven by fundamental data. Note that our analysis may not factor in the latest price-sensitive company announcements or qualitative material. Simply Wall St has no position in any stocks mentioned.
About BIT:SFER
Salvatore Ferragamo
Through its subsidiaries, creates, produces, and sells luxury goods for men and women in Europe, North America, Japan, the Asia Pacific, and Central and South America.
Good value with reasonable growth potential.
Similar Companies
Market Insights

Community Narratives
