
Advertisement
- Italy
- /
- Aerospace & Defense
- /
- BIT:LDO
Is Leonardo S.p.a.'s (BIT:LDO) Recent Stock Performance Tethered To Its Strong Fundamentals?

Leonardo (BIT:LDO) has had a great run on the share market with its stock up by a significant 19% over the last three months. Since the market usually pay for a company’s long-term fundamentals, we decided to study the company’s key performance indicators to see if they could be influencing the market. Specifically, we decided to study Leonardo's ROE in this article.
Return on equity or ROE is a key measure used to assess how efficiently a company's management is utilizing the company's capital. In short, ROE shows the profit each dollar generates with respect to its shareholder investments.
Check out our latest analysis for Leonardo
How Is ROE Calculated?
Return on equity can be calculated by using the formula:
Return on Equity = Net Profit (from continuing operations) ÷ Shareholders' Equity
So, based on the above formula, the ROE for Leonardo is:
10% = €835m ÷ €8.0b (Based on the trailing twelve months to September 2023).
The 'return' is the amount earned after tax over the last twelve months. So, this means that for every €1 of its shareholder's investments, the company generates a profit of €0.10.
Why Is ROE Important For Earnings Growth?
Thus far, we have learned that ROE measures how efficiently a company is generating its profits. We now need to evaluate how much profit the company reinvests or "retains" for future growth which then gives us an idea about the growth potential of the company. Assuming everything else remains unchanged, the higher the ROE and profit retention, the higher the growth rate of a company compared to companies that don't necessarily bear these characteristics.
A Side By Side comparison of Leonardo's Earnings Growth And 10% ROE
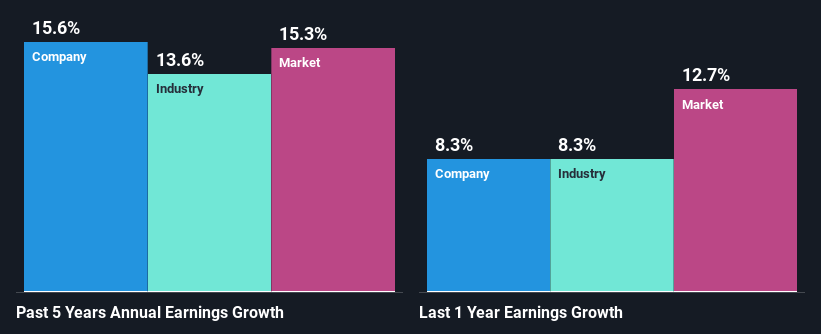
To begin with, Leonardo seems to have a respectable ROE. Further, the company's ROE is similar to the industry average of 9.5%. Consequently, this likely laid the ground for the decent growth of 16% seen over the past five years by Leonardo.
Next, on comparing Leonardo's net income growth with the industry, we found that the company's reported growth is similar to the industry average growth rate of 14% over the last few years.
Earnings growth is an important metric to consider when valuing a stock. The investor should try to establish if the expected growth or decline in earnings, whichever the case may be, is priced in. By doing so, they will have an idea if the stock is headed into clear blue waters or if swampy waters await. Has the market priced in the future outlook for LDO? You can find out in our latest intrinsic value infographic research report.
Is Leonardo Efficiently Re-investing Its Profits?
In Leonardo's case, its respectable earnings growth can probably be explained by its low three-year median payout ratio of 11% (or a retention ratio of 89%), which suggests that the company is investing most of its profits to grow its business.
Besides, Leonardo has been paying dividends over a period of seven years. This shows that the company is committed to sharing profits with its shareholders. Upon studying the latest analysts' consensus data, we found that the company is expected to keep paying out approximately 10% of its profits over the next three years. Therefore, the company's future ROE is also not expected to change by much with analysts predicting an ROE of 9.1%.
Summary
Overall, we are quite pleased with Leonardo's performance. Particularly, we like that the company is reinvesting heavily into its business, and at a high rate of return. Unsurprisingly, this has led to an impressive earnings growth. Having said that, the company's earnings growth is expected to slow down, as forecasted in the current analyst estimates. To know more about the company's future earnings growth forecasts take a look at this free report on analyst forecasts for the company to find out more.
New: AI Stock Screener & Alerts
Our new AI Stock Screener scans the market every day to uncover opportunities.
• Dividend Powerhouses (3%+ Yield)
• Undervalued Small Caps with Insider Buying
• High growth Tech and AI Companies
Or build your own from over 50 metrics.
Have feedback on this article? Concerned about the content? Get in touch with us directly. Alternatively, email editorial-team (at) simplywallst.com.
This article by Simply Wall St is general in nature. We provide commentary based on historical data and analyst forecasts only using an unbiased methodology and our articles are not intended to be financial advice. It does not constitute a recommendation to buy or sell any stock, and does not take account of your objectives, or your financial situation. We aim to bring you long-term focused analysis driven by fundamental data. Note that our analysis may not factor in the latest price-sensitive company announcements or qualitative material. Simply Wall St has no position in any stocks mentioned.
About BIT:LDO
Leonardo
An industrial and technological company, engages in the helicopters, defense electronics and security, cyber security and solutions, aircraft, aerostructures, and space sectors in Italy, the United Kingdom, rest of Europe, the United States of America, and internationally.
Excellent balance sheet and fair value.
Similar Companies
Market Insights


Advertisement
Community Narratives
The Future of Drug Testing? Fingerprint Tech Shows Serious Promise
Fair Value US$2.98|38.6% undervalued
JO
Community Contributor
Suncorp’s Next Chapter: Insurance-Only and Ready to Grow
Fair Value AU$22.83|8.8% undervalued
RO
Community Contributor
Thyssenkrupp Nucera Will Achieve Double-Digit Profits by 2030 Boosted by Hydrogen Growth
Fair Value €14.40|31.6% undervalued
CH
Community Contributor
Tesla’s Nvidia Moment – The AI & Robotics Inflection Point
Fair Value US$384.84|18.0% undervalued
BL
Community Contributor