Advertisement
- India
- /
- Renewable Energy
- /
- NSEI:PTC
Top Dividend Stocks To Watch On The Indian Exchange

Simply Wall St
Reviewed by Simply Wall St
Over the last 7 days, the Indian market has dropped 1.2%, but it has risen by 38% over the past year, with earnings forecast to grow by 17% annually. In this dynamic environment, dividend stocks can offer a blend of income and potential growth, making them an attractive option for investors seeking stability and returns.
Top 10 Dividend Stocks In India
| Name | Dividend Yield | Dividend Rating |
| Castrol India (BSE:500870) | 3.08% | ★★★★★★ |
| Balmer Lawrie Investments (BSE:532485) | 3.85% | ★★★★★★ |
| D. B (NSEI:DBCORP) | 4.97% | ★★★★★☆ |
| VST Industries (BSE:509966) | 3.13% | ★★★★★☆ |
| Indian Oil (NSEI:IOC) | 7.97% | ★★★★★☆ |
| Redington (NSEI:REDINGTON) | 3.18% | ★★★★★☆ |
| Canara Bank (NSEI:CANBK) | 3.11% | ★★★★★☆ |
| Balmer Lawrie (BSE:523319) | 3.01% | ★★★★★☆ |
| Bank of Baroda (NSEI:BANKBARODA) | 3.22% | ★★★★★☆ |
| PTC India (NSEI:PTC) | 3.57% | ★★★★★☆ |
Click here to see the full list of 18 stocks from our Top Indian Dividend Stocks screener.
Below we spotlight a couple of our favorites from our exclusive screener.
D. B (NSEI:DBCORP)
Simply Wall St Dividend Rating: ★★★★★☆
Overview: D. B. Corp Limited operates in newspaper printing and publishing, radio broadcasting, and digital news platforms for news and event management in India and internationally, with a market cap of ₹60.97 billion.
Operations: D. B. Corp Limited generates revenue primarily from printing, publishing, and allied businesses (₹22.77 billion) and radio broadcasting (₹1.62 billion).
Dividend Yield: 5%
D. B. Corp Limited's dividend yield of 4.97% places it in the top 25% of Indian market payers, supported by a reasonable cash payout ratio (57%) and earnings coverage (65.2%). Despite recent earnings growth and improved Q1 results, its dividend history is volatile with past declines over 20%. The company recently declared an interim dividend of ₹7 per share for FY2024-25, indicating ongoing shareholder returns amidst fluctuating payouts.
- Dive into the specifics of D. B here with our thorough dividend report.
- According our valuation report, there's an indication that D. B's share price might be on the cheaper side.

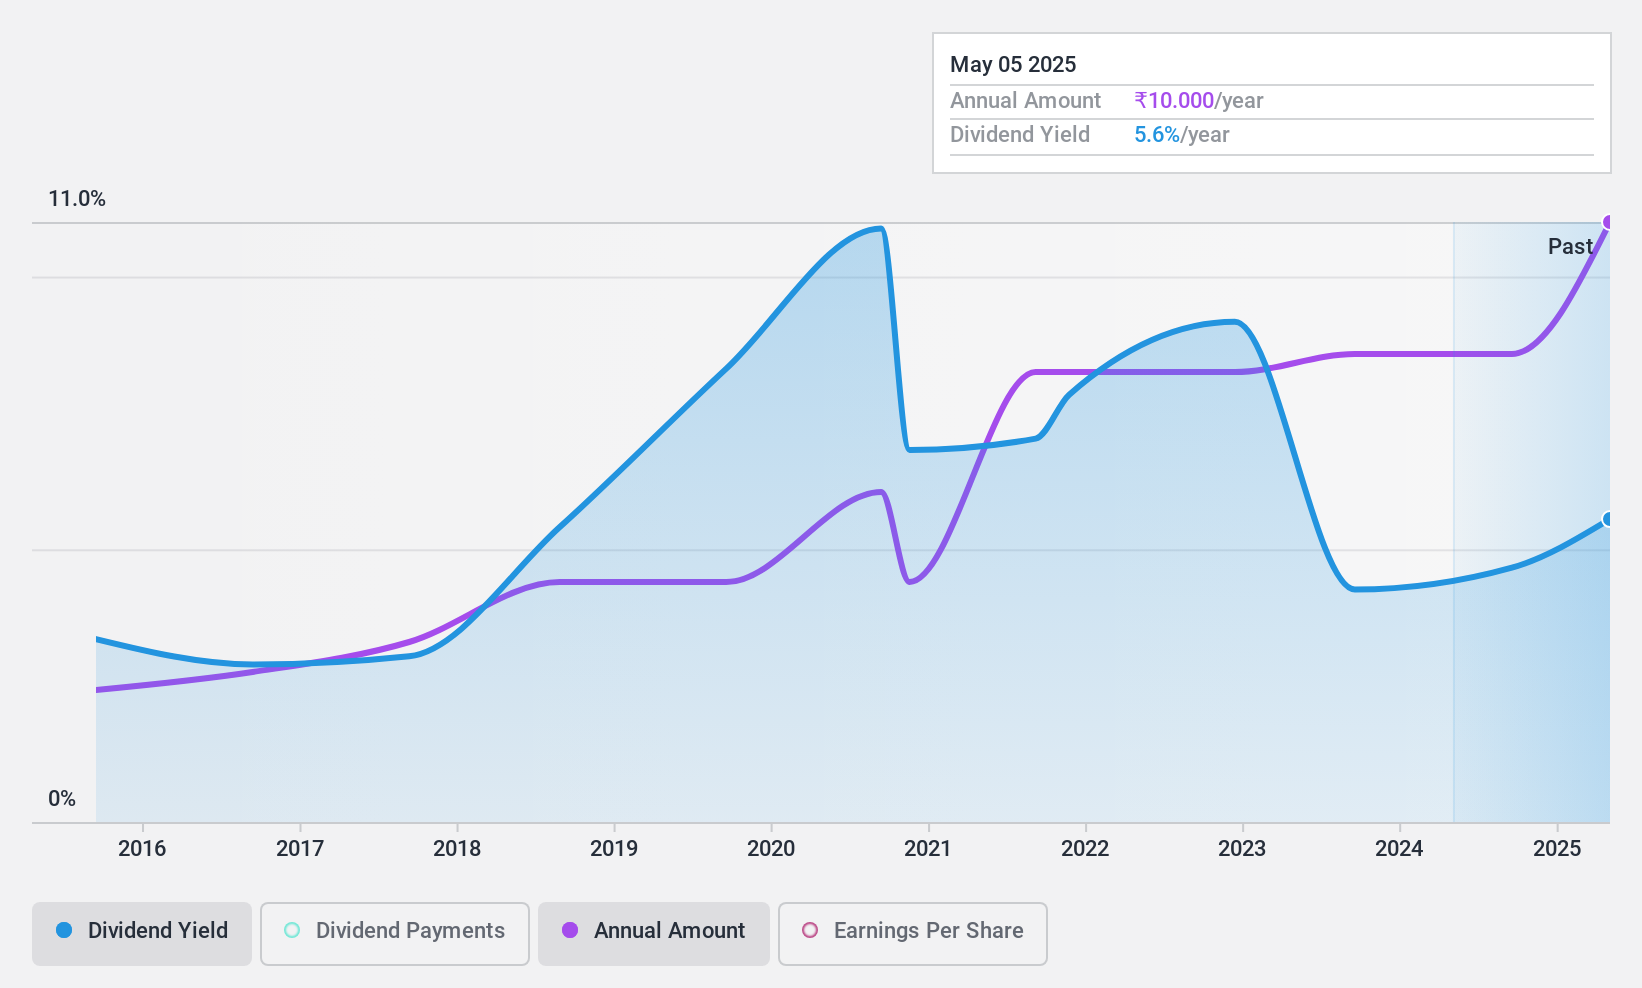
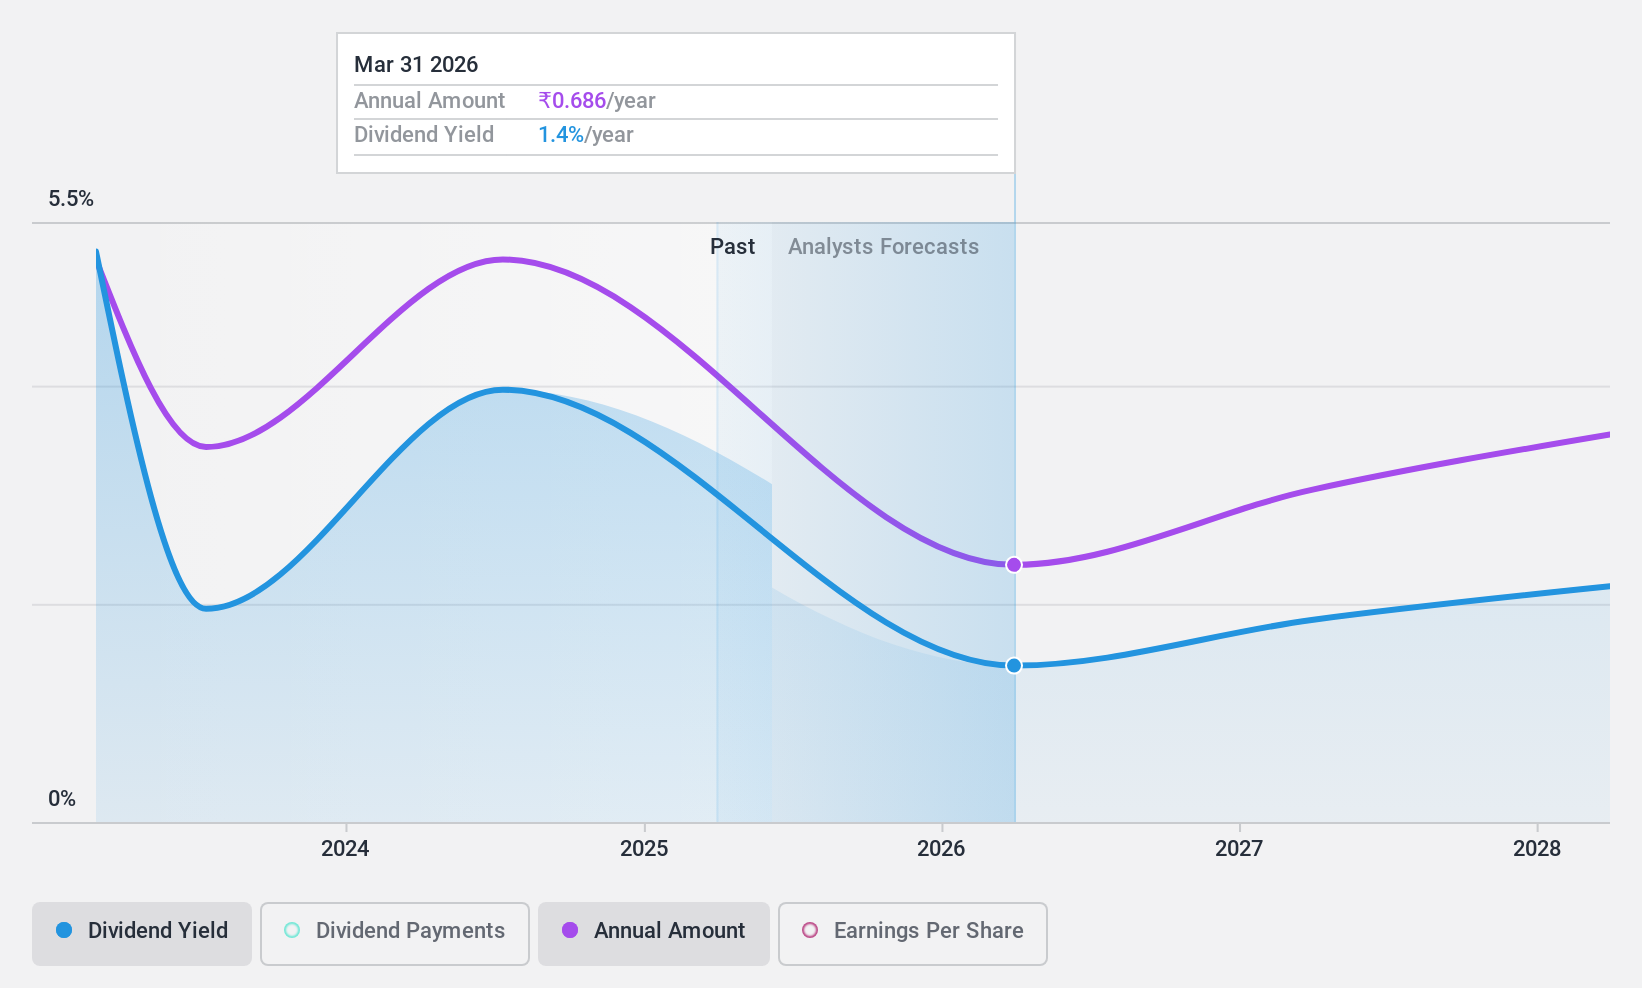
PTC India (NSEI:PTC)
Simply Wall St Dividend Rating: ★★★★★☆
Overview: PTC India Limited, with a market cap of ₹64.72 billion, engages in the trading of power across India, Nepal, Bhutan, and Bangladesh through its subsidiaries.
Operations: PTC India Limited's revenue segments include ₹159.67 billion from power trading and ₹7.35 billion from its financing business.
Dividend Yield: 3.6%
PTC India Limited's dividend yield of 3.57% ranks in the top 25% of Indian market payers, supported by a low cash payout ratio (9.4%) and earnings coverage (54%). Despite recent earnings growth, with Q1 net income rising to ₹1.74 billion from ₹1.30 billion last year, its dividend history is unstable with past volatility over 20%. Recent management changes and regulatory actions may impact future stability and investor confidence.
- Delve into the full analysis dividend report here for a deeper understanding of PTC India.
- According our valuation report, there's an indication that PTC India's share price might be on the expensive side.
Ujjivan Small Finance Bank (NSEI:UJJIVANSFB)
Simply Wall St Dividend Rating: ★★★★☆☆
Overview: Ujjivan Small Finance Bank Limited provides various banking and financial services in India and has a market cap of ₹82.48 billion.
Operations: Ujjivan Small Finance Bank Limited generates revenue from three main segments: Treasury (₹7.58 billion), Retail Banking (₹58.71 billion), and Wholesale Banking (₹1.44 billion).
Dividend Yield: 3.5%
Ujjivan Small Finance Bank's dividend yield of 3.52% is among the top 25% in India, with a low payout ratio (22.6%) indicating strong earnings coverage. However, its short dividend history of only two years has shown volatility and no growth in payments. The bank's high level of bad loans (2.3%) and recent earnings decline to ₹3 billion from ₹3.24 billion last year may raise concerns about future stability despite trading at a good value relative to peers and industry estimates.
- Unlock comprehensive insights into our analysis of Ujjivan Small Finance Bank stock in this dividend report.
- The valuation report we've compiled suggests that Ujjivan Small Finance Bank's current price could be quite moderate.
Turning Ideas Into Actions
- Get an in-depth perspective on all 18 Top Indian Dividend Stocks by using our screener here.
- Have a stake in these businesses? Integrate your holdings into Simply Wall St's portfolio for notifications and detailed stock reports.
- Streamline your investment strategy with Simply Wall St's app for free and benefit from extensive research on stocks across all corners of the world.
Curious About Other Options?
- Explore high-performing small cap companies that haven't yet garnered significant analyst attention.
- Fuel your portfolio with companies showing strong growth potential, backed by optimistic outlooks both from analysts and management.
- Find companies with promising cash flow potential yet trading below their fair value.
This article by Simply Wall St is general in nature. We provide commentary based on historical data and analyst forecasts only using an unbiased methodology and our articles are not intended to be financial advice. It does not constitute a recommendation to buy or sell any stock, and does not take account of your objectives, or your financial situation. We aim to bring you long-term focused analysis driven by fundamental data. Note that our analysis may not factor in the latest price-sensitive company announcements or qualitative material. Simply Wall St has no position in any stocks mentioned.
New: Manage All Your Stock Portfolios in One Place
We've created the ultimate portfolio companion for stock investors, and it's free.
• Connect an unlimited number of Portfolios and see your total in one currency
• Be alerted to new Warning Signs or Risks via email or mobile
• Track the Fair Value of your stocks
Have feedback on this article? Concerned about the content? Get in touch with us directly. Alternatively, email editorial-team@simplywallst.com
About NSEI:PTC
PTC India
Engages in the trading and generating of power in India, Nepal, Bhutan, and Bangladesh.
Flawless balance sheet established dividend payer.
Market Insights


Advertisement
Community Narratives
America Wants Homegrown Drones — Draganfly Is Ready to Deliver
Fair Value US$9.21|27.4% undervalued
JO
Community Contributor
Cheesecake Factory offers an enticing opportunity for long-term growth by leveraging new concepts
Fair Value US$73.83|25.8% undervalued
ZW
Community Contributor
Coca-Cola’s Intrinsic Value Set to Rise with Fed Rate Cut
Fair Value US$67.50|2.7% undervalued
AL
Community Contributor
Fully Permitted Gold Mine with 50 Baggers Potential 
Fair Value CA$41.00|98.0% undervalued
RO
Community Contributor