- India
- /
- Electric Utilities
- /
- NSEI:ENERGYDEV
These 4 Measures Indicate That Energy Development (NSE:ENERGYDEV) Is Using Debt Extensively

David Iben put it well when he said, 'Volatility is not a risk we care about. What we care about is avoiding the permanent loss of capital.' It's only natural to consider a company's balance sheet when you examine how risky it is, since debt is often involved when a business collapses. As with many other companies Energy Development Company Limited (NSE:ENERGYDEV) makes use of debt. But the real question is whether this debt is making the company risky.
What Risk Does Debt Bring?
Generally speaking, debt only becomes a real problem when a company can't easily pay it off, either by raising capital or with its own cash flow. If things get really bad, the lenders can take control of the business. While that is not too common, we often do see indebted companies permanently diluting shareholders because lenders force them to raise capital at a distressed price. Of course, the upside of debt is that it often represents cheap capital, especially when it replaces dilution in a company with the ability to reinvest at high rates of return. When we think about a company's use of debt, we first look at cash and debt together.
Check out our latest analysis for Energy Development
How Much Debt Does Energy Development Carry?
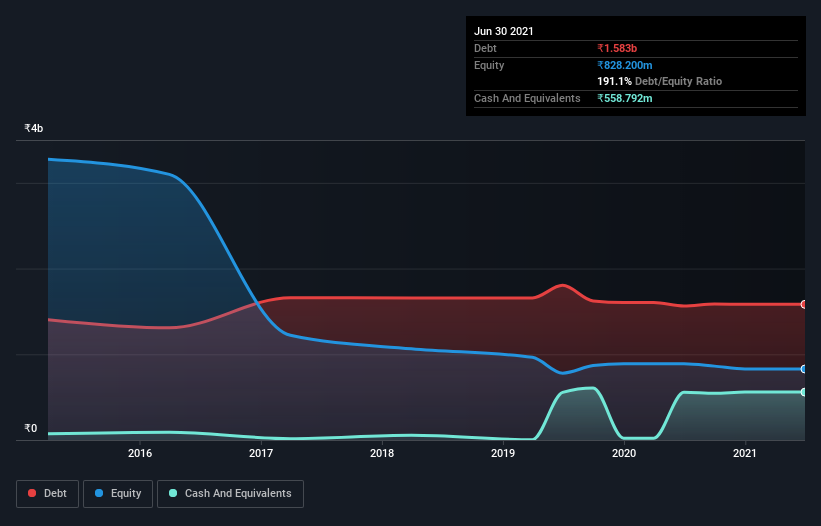
The chart below, which you can click on for greater detail, shows that Energy Development had ₹1.58b in debt in March 2021; about the same as the year before. However, it does have ₹558.8m in cash offsetting this, leading to net debt of about ₹1.02b.
How Healthy Is Energy Development's Balance Sheet?
We can see from the most recent balance sheet that Energy Development had liabilities of ₹1.03b falling due within a year, and liabilities of ₹1.60b due beyond that. Offsetting this, it had ₹558.8m in cash and ₹492.1m in receivables that were due within 12 months. So its liabilities total ₹1.58b more than the combination of its cash and short-term receivables.
The deficiency here weighs heavily on the ₹417.5m company itself, as if a child were struggling under the weight of an enormous back-pack full of books, his sports gear, and a trumpet. So we'd watch its balance sheet closely, without a doubt. At the end of the day, Energy Development would probably need a major re-capitalization if its creditors were to demand repayment.
We use two main ratios to inform us about debt levels relative to earnings. The first is net debt divided by earnings before interest, tax, depreciation, and amortization (EBITDA), while the second is how many times its earnings before interest and tax (EBIT) covers its interest expense (or its interest cover, for short). The advantage of this approach is that we take into account both the absolute quantum of debt (with net debt to EBITDA) and the actual interest expenses associated with that debt (with its interest cover ratio).
While we wouldn't worry about Energy Development's net debt to EBITDA ratio of 4.9, we think its super-low interest cover of 0.56 times is a sign of high leverage. So shareholders should probably be aware that interest expenses appear to have really impacted the business lately. However, it should be some comfort for shareholders to recall that Energy Development actually grew its EBIT by a hefty 314%, over the last 12 months. If it can keep walking that path it will be in a position to shed its debt with relative ease. There's no doubt that we learn most about debt from the balance sheet. But it is Energy Development's earnings that will influence how the balance sheet holds up in the future. So when considering debt, it's definitely worth looking at the earnings trend. Click here for an interactive snapshot.
But our final consideration is also important, because a company cannot pay debt with paper profits; it needs cold hard cash. So we always check how much of that EBIT is translated into free cash flow. Happily for any shareholders, Energy Development actually produced more free cash flow than EBIT over the last three years. That sort of strong cash generation warms our hearts like a puppy in a bumblebee suit.
Our View
While Energy Development's level of total liabilities has us nervous. For example, its conversion of EBIT to free cash flow and EBIT growth rate give us some confidence in its ability to manage its debt. We should also note that Electric Utilities industry companies like Energy Development commonly do use debt without problems. Taking the abovementioned factors together we do think Energy Development's debt poses some risks to the business. While that debt can boost returns, we think the company has enough leverage now. There's no doubt that we learn most about debt from the balance sheet. However, not all investment risk resides within the balance sheet - far from it. For example, we've discovered 3 warning signs for Energy Development (1 makes us a bit uncomfortable!) that you should be aware of before investing here.
If you're interested in investing in businesses that can grow profits without the burden of debt, then check out this free list of growing businesses that have net cash on the balance sheet.
If you’re looking to trade Energy Development, open an account with the lowest-cost* platform trusted by professionals, Interactive Brokers. Their clients from over 200 countries and territories trade stocks, options, futures, forex, bonds and funds worldwide from a single integrated account. Promoted
Mobile Infrastructure for Defense and Disaster
The next wave in robotics isn't humanoid. Its fully autonomous towers delivering 5G, ISR, and radar in under 30 minutes, anywhere.
Get the investor briefing before the next round of contracts
Sponsored On Behalf of CiTechValuation is complex, but we're here to simplify it.
Discover if Energy Development might be undervalued or overvalued with our detailed analysis, featuring fair value estimates, potential risks, dividends, insider trades, and its financial condition.
Access Free AnalysisThis article by Simply Wall St is general in nature. We provide commentary based on historical data and analyst forecasts only using an unbiased methodology and our articles are not intended to be financial advice. It does not constitute a recommendation to buy or sell any stock, and does not take account of your objectives, or your financial situation. We aim to bring you long-term focused analysis driven by fundamental data. Note that our analysis may not factor in the latest price-sensitive company announcements or qualitative material. Simply Wall St has no position in any stocks mentioned.
*Interactive Brokers Rated Lowest Cost Broker by StockBrokers.com Annual Online Review 2020
Have feedback on this article? Concerned about the content? Get in touch with us directly. Alternatively, email editorial-team (at) simplywallst.com.
About NSEI:ENERGYDEV
Energy Development
Generates and sells electricity from water and wind to various electricity boards in India.
Slight risk and slightly overvalued.
Market Insights

Weekly Picks

THE KINGDOM OF BROWN GOODS: WHY MGPI IS BEING CRUSHED BY INVENTORY & PRIMED FOR RESURRECTION


Why Vertical Aerospace (NYSE: EVTL) is Worth Possibly Over 13x its Current Price


The Quiet Giant That Became AI’s Power Grid
Recently Updated Narratives

Agfa-Gevaert is a digital and materials turnaround opportunity, with growth potential in ZIRFON, but carrying legacy risks.

Hitit Bilgisayar Hizmetleri will achieve a 19.7% revenue boost in the next five years


MINISO's fair value is projected at 26.69 with an anticipated PE ratio shift of 20x
Popular Narratives


MicroVision will explode future revenue by 380.37% with a vision towards success


Crazy Undervalued 42 Baggers Silver Play (Active & Running Mine)


