
Advertisement
- India
- /
- Infrastructure
- /
- NSEI:MEP
We Think MEP Infrastructure Developers (NSE:MEP) Is Taking Some Risk With Its Debt
The external fund manager backed by Berkshire Hathaway's Charlie Munger, Li Lu, makes no bones about it when he says 'The biggest investment risk is not the volatility of prices, but whether you will suffer a permanent loss of capital.' When we think about how risky a company is, we always like to look at its use of debt, since debt overload can lead to ruin. We can see that MEP Infrastructure Developers Limited (NSE:MEP) does use debt in its business. But the more important question is: how much risk is that debt creating?
When Is Debt Dangerous?
Debt assists a business until the business has trouble paying it off, either with new capital or with free cash flow. If things get really bad, the lenders can take control of the business. However, a more frequent (but still costly) occurrence is where a company must issue shares at bargain-basement prices, permanently diluting shareholders, just to shore up its balance sheet. Of course, debt can be an important tool in businesses, particularly capital heavy businesses. The first step when considering a company's debt levels is to consider its cash and debt together.
View our latest analysis for MEP Infrastructure Developers
What Is MEP Infrastructure Developers's Net Debt?
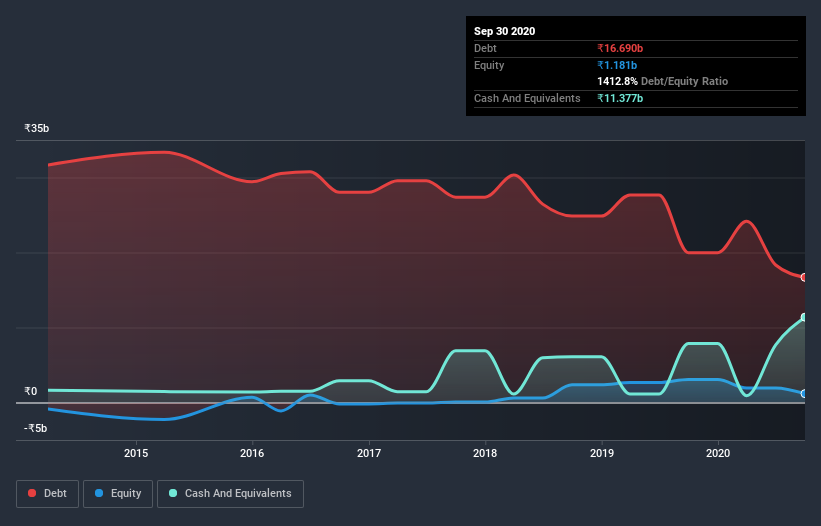
As you can see below, MEP Infrastructure Developers had ₹16.4b of debt at September 2020, down from ₹20.0b a year prior. However, it also had ₹11.4b in cash, and so its net debt is ₹5.01b.
How Strong Is MEP Infrastructure Developers' Balance Sheet?
According to the last reported balance sheet, MEP Infrastructure Developers had liabilities of ₹33.5b due within 12 months, and liabilities of ₹16.0b due beyond 12 months. On the other hand, it had cash of ₹11.4b and ₹5.08b worth of receivables due within a year. So it has liabilities totalling ₹33.1b more than its cash and near-term receivables, combined.
The deficiency here weighs heavily on the ₹3.42b company itself, as if a child were struggling under the weight of an enormous back-pack full of books, his sports gear, and a trumpet. So we'd watch its balance sheet closely, without a doubt. At the end of the day, MEP Infrastructure Developers would probably need a major re-capitalization if its creditors were to demand repayment.
In order to size up a company's debt relative to its earnings, we calculate its net debt divided by its earnings before interest, tax, depreciation, and amortization (EBITDA) and its earnings before interest and tax (EBIT) divided by its interest expense (its interest cover). This way, we consider both the absolute quantum of the debt, as well as the interest rates paid on it.
Given net debt is only 1.3 times EBITDA, it is initially surprising to see that MEP Infrastructure Developers's EBIT has low interest coverage of 0.044 times. So one way or the other, it's clear the debt levels are not trivial. Shareholders should be aware that MEP Infrastructure Developers's EBIT was down 96% last year. If that decline continues then paying off debt will be harder than selling foie gras at a vegan convention. The balance sheet is clearly the area to focus on when you are analysing debt. But you can't view debt in total isolation; since MEP Infrastructure Developers will need earnings to service that debt. So if you're keen to discover more about its earnings, it might be worth checking out this graph of its long term earnings trend.
Finally, a company can only pay off debt with cold hard cash, not accounting profits. So the logical step is to look at the proportion of that EBIT that is matched by actual free cash flow. Over the last three years, MEP Infrastructure Developers actually produced more free cash flow than EBIT. That sort of strong cash generation warms our hearts like a puppy in a bumblebee suit.
Our View
To be frank both MEP Infrastructure Developers's EBIT growth rate and its track record of staying on top of its total liabilities make us rather uncomfortable with its debt levels. But on the bright side, its conversion of EBIT to free cash flow is a good sign, and makes us more optimistic. It's also worth noting that MEP Infrastructure Developers is in the Infrastructure industry, which is often considered to be quite defensive. Overall, it seems to us that MEP Infrastructure Developers's balance sheet is really quite a risk to the business. For this reason we're pretty cautious about the stock, and we think shareholders should keep a close eye on its liquidity. There's no doubt that we learn most about debt from the balance sheet. But ultimately, every company can contain risks that exist outside of the balance sheet. To that end, you should learn about the 4 warning signs we've spotted with MEP Infrastructure Developers (including 2 which are significant) .
If, after all that, you're more interested in a fast growing company with a rock-solid balance sheet, then check out our list of net cash growth stocks without delay.
If you decide to trade MEP Infrastructure Developers, use the lowest-cost* platform that is rated #1 Overall by Barron’s, Interactive Brokers. Trade stocks, options, futures, forex, bonds and funds on 135 markets, all from a single integrated account. Promoted
New: Manage All Your Stock Portfolios in One Place
We've created the ultimate portfolio companion for stock investors, and it's free.
• Connect an unlimited number of Portfolios and see your total in one currency
• Be alerted to new Warning Signs or Risks via email or mobile
• Track the Fair Value of your stocks
This article by Simply Wall St is general in nature. It does not constitute a recommendation to buy or sell any stock, and does not take account of your objectives, or your financial situation. We aim to bring you long-term focused analysis driven by fundamental data. Note that our analysis may not factor in the latest price-sensitive company announcements or qualitative material. Simply Wall St has no position in any stocks mentioned.
*Interactive Brokers Rated Lowest Cost Broker by StockBrokers.com Annual Online Review 2020
Have feedback on this article? Concerned about the content? Get in touch with us directly. Alternatively, email editorial-team (at) simplywallst.com.
MI

The Foxhole
A landmark settlement is meant to punish Meta (META). If the 1998 tobacco deal is any guide, it might protect it.
118
ZO
zoe_vi5fn
Any moat with an opt-out clause for your competitors is just a fence around your own garden.
CO
connor_iwn1g
Worth looking at what previous legal action actually did to Meta rather than reaching for tobacco. The FTC's record five billion dollar privacy fine in 2019 was met with the stock rising, because it came in below fears and removed an open question. GDPR was designed to constrain large platforms and increased their share of the European ad market, because compliance cost fell hardest on small intermediaries. The FTC's antitrust case, the one that could genuinely have broken the company up, was decided in Meta's favour last November. The only thing that ever meaningfully hurt the business was Apple changing a tracking default, and Meta out-spent that too, while the ad-tech firms that could not afford to rebuild disappeared. The pattern is not that Meta survives regulation. It is that regulation keeps costing its smaller competitors more.
 Andrew Legget
Market Insights
Great earnings season, but are the earnings real?

At first glance, this was the strongest earnings season in years. But when you look at where the growth actually came from, the story splits into two very different pictures.
10
About NSEI:MEP
MEP Infrastructure Developers
Engages in the construction, operation, and maintenance of road infrastructure in India.
Very low risk with weak fundamentals.
Market Insights


Advertisement
Weekly Picks
LO


Lou_Basenese on Oncolytics Biotech ·
The Team Behind a $2 Billion Johnson & Johnson (JNJ) Deal Just Took Over This $105 Million Cancer Biotech
Fair Value:US$3.575.5% undervalued
26 followersusers have followed this narrative
0 commentsusers have commented on this narrative
7 likesusers have liked this narrative
TR


tripledub on Meta Platforms ·
The $135 Billion Bet That Should Make Every Shareholder Nervous
Fair Value:US$5861.4% undervalued
59 followersusers have followed this narrative
3 commentsusers have commented on this narrative
34 likesusers have liked this narrative
TA


Talos on Voyager Technologies ·
The "Landlord of Orbit" – A Deep Value Play Ahead of the Starlab Era
Fair Value:US$385.291.1% undervalued
62 followersusers have followed this narrative
0 commentsusers have commented on this narrative
6 likesusers have liked this narrative
IV

Ivoed on Uber Technologies ·
Uber’s Valuation Depends On Who Captures The Economics Of Driverless Rides
Fair Value:US$11632.1% undervalued
12 followersusers have followed this narrative
0 commentsusers have commented on this narrative
3 likesusers have liked this narrative
Recently Updated Narratives
DA

dang on Resonance Health ·
Resonance Health will triple revenue growth to 30.83% in five years
Fair Value:AU$0.08331.3% undervalued
1 followerusers have followed this narrative
0 commentsusers have commented on this narrative
0 likesusers have liked this narrative
RO


RockeTeller on Santacruz Silver Mining ·
Santacruz Silver, 5.6M Oz Silver Producer Trading at Low Multiples, 100X Per-Share Upside in $200 Silver
Fair Value:CA$142.990.7% undervalued
96 followersusers have followed this narrative
14 commentsusers have commented on this narrative
0 likesusers have liked this narrative
CO


composite32 on Eaton ·
"Grid-to-Chip: How Eaton Controls the Physical Bottlenecks of AI Data Centers"
Fair Value:US$517.0622.1% undervalued
1 followerusers have followed this narrative
0 commentsusers have commented on this narrative
0 likesusers have liked this narrative
Popular Narratives
OS


oscargarcia on NVIDIA ·
The company that went from selling GPUs to gamers to becoming the AI arms dealer of the 21st century.
Fair Value:US$28022.3% undervalued
364 followersusers have followed this narrative
9 commentsusers have commented on this narrative
16 likesusers have liked this narrative
CU

CubanEros on Microsoft ·
A wonderful business at reasonable price.
Fair Value:US$419.9122.3% overvalued
212 followersusers have followed this narrative
0 commentsusers have commented on this narrative
9 likesusers have liked this narrative
KI

KiwiInvest on Amazon.com ·
Amazon's high growth, high tech segments propel its profits, while traditional segments plod along
Fair Value:US$475.0943.9% undervalued
240 followersusers have followed this narrative
1 commentusers have commented on this narrative
8 likesusers have liked this narrative
Trending Discussion

DA

david_8pjjo on Axon Enterprise ·
One factor to consider for Axon's growth is whether the Russia - Ukraine war continues. Axon's Dedrone (dead drone) product could be a game changer, however if it is too successful, it could lead to an end of the war, thereby reducing Dedrone sales - an unintended consequence!David Lane
0
|0
