Blue Dart Express (NSE:BLUEDART) Knows How To Allocate Capital


What are the early trends we should look for to identify a stock that could multiply in value over the long term? Ideally, a business will show two trends; firstly a growing return on capital employed (ROCE) and secondly, an increasing amount of capital employed. If you see this, it typically means it's a company with a great business model and plenty of profitable reinvestment opportunities. So, when we ran our eye over Blue Dart Express' (NSE:BLUEDART) trend of ROCE, we really liked what we saw.
Understanding Return On Capital Employed (ROCE)
For those that aren't sure what ROCE is, it measures the amount of pre-tax profits a company can generate from the capital employed in its business. Analysts use this formula to calculate it for Blue Dart Express:
Return on Capital Employed = Earnings Before Interest and Tax (EBIT) ÷ (Total Assets - Current Liabilities)
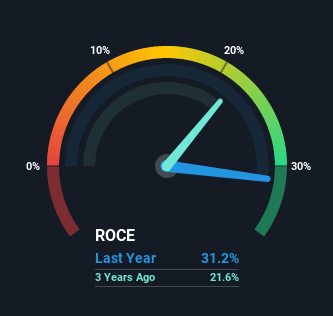
0.31 = ₹5.3b ÷ (₹28b - ₹11b) (Based on the trailing twelve months to September 2021).
So, Blue Dart Express has an ROCE of 31%. That's a fantastic return and not only that, it outpaces the average of 16% earned by companies in a similar industry.
Check out our latest analysis for Blue Dart Express
Above you can see how the current ROCE for Blue Dart Express compares to its prior returns on capital, but there's only so much you can tell from the past. If you'd like, you can check out the forecasts from the analysts covering Blue Dart Express here for free.
What The Trend Of ROCE Can Tell Us
It's hard not to be impressed by Blue Dart Express' returns on capital. Over the past five years, ROCE has remained relatively flat at around 31% and the business has deployed 103% more capital into its operations. With returns that high, it's great that the business can continually reinvest its money at such appealing rates of return. If Blue Dart Express can keep this up, we'd be very optimistic about its future.
Another thing to note, Blue Dart Express has a high ratio of current liabilities to total assets of 40%. This effectively means that suppliers (or short-term creditors) are funding a large portion of the business, so just be aware that this can introduce some elements of risk. While it's not necessarily a bad thing, it can be beneficial if this ratio is lower.
What We Can Learn From Blue Dart Express' ROCE
Blue Dart Express has demonstrated its proficiency by generating high returns on increasing amounts of capital employed, which we're thrilled about. And since the stock has risen strongly over the last five years, it appears the market might expect this trend to continue. So while investors seem to be recognizing these promising trends, we still believe the stock deserves further research.
Before jumping to any conclusions though, we need to know what value we're getting for the current share price. That's where you can check out our FREE intrinsic value estimation that compares the share price and estimated value.
If you'd like to see other companies earning high returns, check out our free list of companies earning high returns with solid balance sheets here.
If you're looking to trade Blue Dart Express, open an account with the lowest-cost platform trusted by professionals, Interactive Brokers.
With clients in over 200 countries and territories, and access to 160 markets, IBKR lets you trade stocks, options, futures, forex, bonds and funds from a single integrated account.
Enjoy no hidden fees, no account minimums, and FX conversion rates as low as 0.03%, far better than what most brokers offer.
Sponsored ContentValuation is complex, but we're here to simplify it.
Discover if Blue Dart Express might be undervalued or overvalued with our detailed analysis, featuring fair value estimates, potential risks, dividends, insider trades, and its financial condition.
Access Free AnalysisHave feedback on this article? Concerned about the content? Get in touch with us directly. Alternatively, email editorial-team (at) simplywallst.com.
This article by Simply Wall St is general in nature. We provide commentary based on historical data and analyst forecasts only using an unbiased methodology and our articles are not intended to be financial advice. It does not constitute a recommendation to buy or sell any stock, and does not take account of your objectives, or your financial situation. We aim to bring you long-term focused analysis driven by fundamental data. Note that our analysis may not factor in the latest price-sensitive company announcements or qualitative material. Simply Wall St has no position in any stocks mentioned.
About NSEI:BLUEDART
High growth potential with adequate balance sheet.
Similar Companies
Market Insights

Community Narratives
