- India
- /
- Electronic Equipment and Components
- /
- NSEI:HONAUT
Here's What Honeywell Automation India Limited's (NSE:HONAUT) P/E Is Telling Us

The goal of this article is to teach you how to use price to earnings ratios (P/E ratios). We'll apply a basic P/E ratio analysis to Honeywell Automation India Limited's (NSE:HONAUT), to help you decide if the stock is worth further research. Honeywell Automation India has a price to earnings ratio of 59.13, based on the last twelve months. That corresponds to an earnings yield of approximately 1.7%.
Want to participate in a short research study? Help shape the future of investing tools and you could win a $250 gift card!
View our latest analysis for Honeywell Automation India
How Do You Calculate Honeywell Automation India's P/E Ratio?
The formula for price to earnings is:
Price to Earnings Ratio = Share Price ÷ Earnings per Share (EPS)
Or for Honeywell Automation India:
P/E of 59.13 = ₹24000 ÷ ₹405.86 (Based on the trailing twelve months to March 2019.)
Is A High Price-to-Earnings Ratio Good?
A higher P/E ratio implies that investors pay a higher price for the earning power of the business. All else being equal, it's better to pay a low price -- but as Warren Buffett said, 'It's far better to buy a wonderful company at a fair price than a fair company at a wonderful price.'
How Growth Rates Impact P/E Ratios
P/E ratios primarily reflect market expectations around earnings growth rates. Earnings growth means that in the future the 'E' will be higher. Therefore, even if you pay a high multiple of earnings now, that multiple will become lower in the future. So while a stock may look expensive based on past earnings, it could be cheap based on future earnings.
Notably, Honeywell Automation India grew EPS by a whopping 44% in the last year. And its annual EPS growth rate over 5 years is 30%. With that performance, I would expect it to have an above average P/E ratio.
Does Honeywell Automation India Have A Relatively High Or Low P/E For Its Industry?
The P/E ratio essentially measures market expectations of a company. You can see in the image below that the average P/E (18.7) for companies in the electronic industry is a lot lower than Honeywell Automation India's P/E.
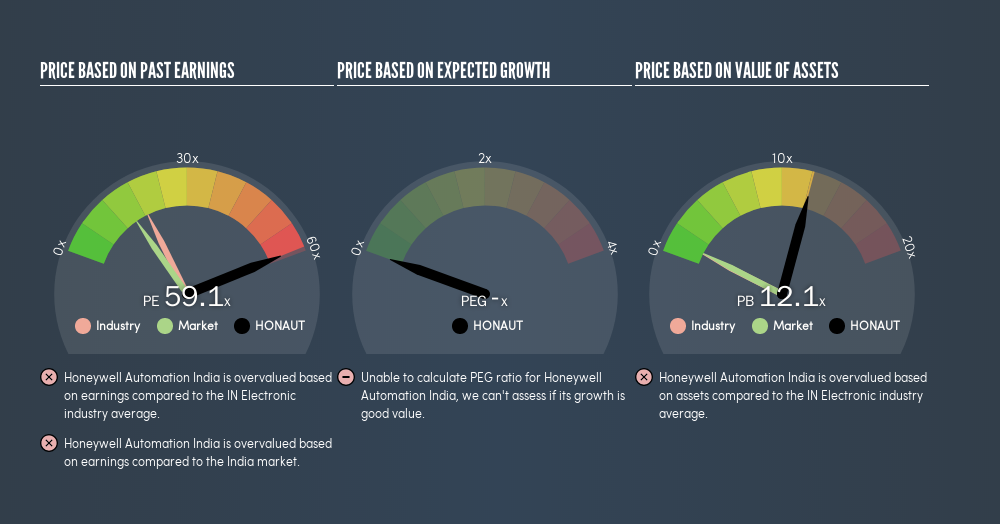
Honeywell Automation India's P/E tells us that market participants think the company will perform better than its industry peers, going forward. Shareholders are clearly optimistic, but the future is always uncertain. So further research is always essential. I often monitor director buying and selling.
Remember: P/E Ratios Don't Consider The Balance Sheet
It's important to note that the P/E ratio considers the market capitalization, not the enterprise value. In other words, it does not consider any debt or cash that the company may have on the balance sheet. The exact same company would hypothetically deserve a higher P/E ratio if it had a strong balance sheet, than if it had a weak one with lots of debt, because a cashed up company can spend on growth.
Such spending might be good or bad, overall, but the key point here is that you need to look at debt to understand the P/E ratio in context.
So What Does Honeywell Automation India's Balance Sheet Tell Us?
Since Honeywell Automation India holds net cash of ₹18b, it can spend on growth, justifying a higher P/E ratio than otherwise.
The Verdict On Honeywell Automation India's P/E Ratio
Honeywell Automation India's P/E is 59.1 which suggests the market is more focussed on the future opportunity rather than the current level of earnings. Its net cash position is the cherry on top of its superb EPS growth. So based on this analysis we'd expect Honeywell Automation India to have a high P/E ratio.
When the market is wrong about a stock, it gives savvy investors an opportunity. As value investor Benjamin Graham famously said, 'In the short run, the market is a voting machine but in the long run, it is a weighing machine.' Although we don't have analyst forecasts, you might want to assess this data-rich visualization of earnings, revenue and cash flow.
Of course, you might find a fantastic investment by looking at a few good candidates. So take a peek at this free list of companies with modest (or no) debt, trading on a P/E below 20.
We aim to bring you long-term focused research analysis driven by fundamental data. Note that our analysis may not factor in the latest price-sensitive company announcements or qualitative material.
If you spot an error that warrants correction, please contact the editor at editorial-team@simplywallst.com. This article by Simply Wall St is general in nature. It does not constitute a recommendation to buy or sell any stock, and does not take account of your objectives, or your financial situation. Simply Wall St has no position in the stocks mentioned. Thank you for reading.
About NSEI:HONAUT
Honeywell Automation India
Manufactures and sells industrial process control and automation systems in India and internationally.
Flawless balance sheet established dividend payer.
Similar Companies
Market Insights

Weekly Picks

THE KINGDOM OF BROWN GOODS: WHY MGPI IS BEING CRUSHED BY INVENTORY & PRIMED FOR RESURRECTION


Why Vertical Aerospace (NYSE: EVTL) is Worth Possibly Over 13x its Current Price


The Quiet Giant That Became AI’s Power Grid
Recently Updated Narratives

Agfa-Gevaert is a digital and materials turnaround opportunity, with growth potential in ZIRFON, but carrying legacy risks.

Hitit Bilgisayar Hizmetleri will achieve a 19.7% revenue boost in the next five years


MINISO's fair value is projected at 26.69 with an anticipated PE ratio shift of 20x
Popular Narratives


MicroVision will explode future revenue by 380.37% with a vision towards success


Crazy Undervalued 42 Baggers Silver Play (Active & Running Mine)


