- India
- /
- Electronic Equipment and Components
- /
- NSEI:CYIENTDLM
Market Participants Recognise Cyient DLM Limited's (NSE:CYIENTDLM) Revenues Pushing Shares 26% Higher
Despite an already strong run, Cyient DLM Limited (NSE:CYIENTDLM) shares have been powering on, with a gain of 26% in the last thirty days. Longer-term shareholders would be thankful for the recovery in the share price since it's now virtually flat for the year after the recent bounce.
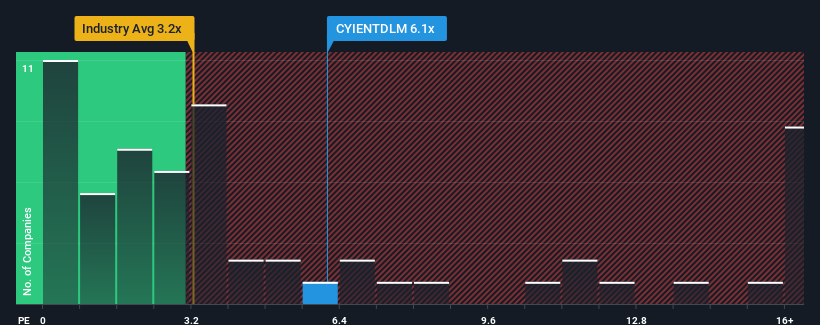
Following the firm bounce in price, given around half the companies in India's Electronic industry have price-to-sales ratios (or "P/S") below 3.2x, you may consider Cyient DLM as a stock to avoid entirely with its 6.1x P/S ratio. However, the P/S might be quite high for a reason and it requires further investigation to determine if it's justified.
Check out our latest analysis for Cyient DLM

What Does Cyient DLM's P/S Mean For Shareholders?
With revenue growth that's superior to most other companies of late, Cyient DLM has been doing relatively well. It seems the market expects this form will continue into the future, hence the elevated P/S ratio. If not, then existing shareholders might be a little nervous about the viability of the share price.
Keen to find out how analysts think Cyient DLM's future stacks up against the industry? In that case, our free report is a great place to start.Is There Enough Revenue Growth Forecasted For Cyient DLM?
In order to justify its P/S ratio, Cyient DLM would need to produce outstanding growth that's well in excess of the industry.
Taking a look back first, we see that the company grew revenue by an impressive 49% last year. The latest three year period has also seen an excellent 76% overall rise in revenue, aided by its short-term performance. Accordingly, shareholders would have definitely welcomed those medium-term rates of revenue growth.
Shifting to the future, estimates from the three analysts covering the company suggest revenue should grow by 43% over the next year. That's shaping up to be materially higher than the 34% growth forecast for the broader industry.
With this in mind, it's not hard to understand why Cyient DLM's P/S is high relative to its industry peers. Apparently shareholders aren't keen to offload something that is potentially eyeing a more prosperous future.
The Final Word
Cyient DLM's P/S has grown nicely over the last month thanks to a handy boost in the share price. We'd say the price-to-sales ratio's power isn't primarily as a valuation instrument but rather to gauge current investor sentiment and future expectations.
We've established that Cyient DLM maintains its high P/S on the strength of its forecasted revenue growth being higher than the the rest of the Electronic industry, as expected. At this stage investors feel the potential for a deterioration in revenues is quite remote, justifying the elevated P/S ratio. Unless the analysts have really missed the mark, these strong revenue forecasts should keep the share price buoyant.
A lot of potential risks can sit within a company's balance sheet. Our free balance sheet analysis for Cyient DLM with six simple checks will allow you to discover any risks that could be an issue.
If strong companies turning a profit tickle your fancy, then you'll want to check out this free list of interesting companies that trade on a low P/E (but have proven they can grow earnings).
New: AI Stock Screener & Alerts
Our new AI Stock Screener scans the market every day to uncover opportunities.
• Dividend Powerhouses (3%+ Yield)
• Undervalued Small Caps with Insider Buying
• High growth Tech and AI Companies
Or build your own from over 50 metrics.
Have feedback on this article? Concerned about the content? Get in touch with us directly. Alternatively, email editorial-team (at) simplywallst.com.
This article by Simply Wall St is general in nature. We provide commentary based on historical data and analyst forecasts only using an unbiased methodology and our articles are not intended to be financial advice. It does not constitute a recommendation to buy or sell any stock, and does not take account of your objectives, or your financial situation. We aim to bring you long-term focused analysis driven by fundamental data. Note that our analysis may not factor in the latest price-sensitive company announcements or qualitative material. Simply Wall St has no position in any stocks mentioned.
About NSEI:CYIENTDLM
Cyient DLM
Provides electronic manufacturing solutions in India, NAM, rest of the Asia-Pacific, Europe, the Middle East, and Africa.
Flawless balance sheet with reasonable growth potential.
Similar Companies
Market Insights
Weekly Picks


Crazy Undervalued 42 Baggers Silver Play (Active & Running Mine)


Fiducian: Compliance Clouds or Value Opportunity?

Willamette Valley Vineyards (WVVI): Not-So-Great Value
Recently Updated Narratives
China Starch Holdings eyes a revenue growth of 4.66% with a 5-year strategic plan

PSIX The timing of insider sales is a serious question mark


The Great Strategy Swap – Selling "Old Auto" to Buy "Future Light"
Popular Narratives


MicroVision will explode future revenue by 380.37% with a vision towards success


NVDA: Expanding AI Demand Will Drive Major Data Center Investments Through 2026


