Advertisement
- India
- /
- Trade Distributors
- /
- NSEI:CNL
Returns on Capital Paint A Bright Future For Creative Newtech (NSE:CREATIVE)
If you're looking for a multi-bagger, there's a few things to keep an eye out for. Firstly, we'll want to see a proven return on capital employed (ROCE) that is increasing, and secondly, an expanding base of capital employed. If you see this, it typically means it's a company with a great business model and plenty of profitable reinvestment opportunities. With that in mind, the ROCE of Creative Newtech (NSE:CREATIVE) looks great, so lets see what the trend can tell us.
Understanding Return On Capital Employed (ROCE)
If you haven't worked with ROCE before, it measures the 'return' (pre-tax profit) a company generates from capital employed in its business. The formula for this calculation on Creative Newtech is:
Return on Capital Employed = Earnings Before Interest and Tax (EBIT) ÷ (Total Assets - Current Liabilities)
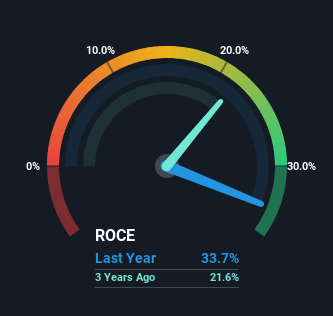
0.34 = ₹458m ÷ (₹2.9b - ₹1.5b) (Based on the trailing twelve months to June 2023).
So, Creative Newtech has an ROCE of 34%. That's a fantastic return and not only that, it outpaces the average of 13% earned by companies in a similar industry.
See our latest analysis for Creative Newtech
While the past is not representative of the future, it can be helpful to know how a company has performed historically, which is why we have this chart above. If you'd like to look at how Creative Newtech has performed in the past in other metrics, you can view this free graph of past earnings, revenue and cash flow.
What Can We Tell From Creative Newtech's ROCE Trend?
Investors would be pleased with what's happening at Creative Newtech. Over the last five years, returns on capital employed have risen substantially to 34%. The company is effectively making more money per dollar of capital used, and it's worth noting that the amount of capital has increased too, by 386%. So we're very much inspired by what we're seeing at Creative Newtech thanks to its ability to profitably reinvest capital.
On a related note, the company's ratio of current liabilities to total assets has decreased to 53%, which basically reduces it's funding from the likes of short-term creditors or suppliers. So shareholders would be pleased that the growth in returns has mostly come from underlying business performance. However, current liabilities are still at a pretty high level, so just be aware that this can bring with it some risks.
The Bottom Line On Creative Newtech's ROCE
All in all, it's terrific to see that Creative Newtech is reaping the rewards from prior investments and is growing its capital base. And a remarkable 914% total return over the last five years tells us that investors are expecting more good things to come in the future. Therefore, we think it would be worth your time to check if these trends are going to continue.
If you want to know some of the risks facing Creative Newtech we've found 3 warning signs (1 is significant!) that you should be aware of before investing here.
If you want to search for more stocks that have been earning high returns, check out this free list of stocks with solid balance sheets that are also earning high returns on equity.
New: AI Stock Screener & Alerts
Our new AI Stock Screener scans the market every day to uncover opportunities.
• Dividend Powerhouses (3%+ Yield)
• Undervalued Small Caps with Insider Buying
• High growth Tech and AI Companies
Or build your own from over 50 metrics.
Have feedback on this article? Concerned about the content? Get in touch with us directly. Alternatively, email editorial-team (at) simplywallst.com.
This article by Simply Wall St is general in nature. We provide commentary based on historical data and analyst forecasts only using an unbiased methodology and our articles are not intended to be financial advice. It does not constitute a recommendation to buy or sell any stock, and does not take account of your objectives, or your financial situation. We aim to bring you long-term focused analysis driven by fundamental data. Note that our analysis may not factor in the latest price-sensitive company announcements or qualitative material. Simply Wall St has no position in any stocks mentioned.
About NSEI:CNL
Creative Newtech
Distributes information technology (IT), gaming, imaging, lifestyle, and security products in India and internationally.
Proven track record with mediocre balance sheet.
Similar Companies
Market Insights


Advertisement
Weekly Picks
LO


Lou_Basenese on Optimi Health ·
The Only Psychedelic Company Already Selling MDMA and Psilocybin to Real Patients, Yet Priced Like It Doesn’t Exist
Fair Value:US$1155.3% undervalued
50 followersusers have followed this narrative
2 commentsusers have commented on this narrative
9 likesusers have liked this narrative
BL


BlackGoat on IREN ·
IREN's Bold Moves in Sustainable Bitcoin Mining & AI Data Centers
Fair Value:US$71.4849.2% undervalued
204 followersusers have followed this narrative
6 commentsusers have commented on this narrative
32 likesusers have liked this narrative
HE


HedgeY on Arm Holdings ·
The Architecture Layer of AI Computing - But Priced Like the Future Already Arrived?
Fair Value:US$43038.1% undervalued
9 followersusers have followed this narrative
1 commentusers have commented on this narrative
3 likesusers have liked this narrative
HI


Hidden_Rock_Capital on Fiserv ·
Temporary "perfect storm" leads to opportunity to buy financial services leader for less than 5x long-term earnings
Fair Value:US$119.9956.4% undervalued
13 followersusers have followed this narrative
0 commentsusers have commented on this narrative
6 likesusers have liked this narrative
Recently Updated Narratives
CL


Clive_Thompson on Green Tea Group ·
One of China's Fastest-Growing Restaurant Chains Trades on Just 7x Earnings and an 8% Dividend
Fair Value:HK$8.728.9% undervalued
1 followerusers have followed this narrative
0 commentsusers have commented on this narrative
0 likesusers have liked this narrative
AZ

aziz_22khi on PRG Holdings Berhad ·
WHERE DID THE SIX MILLION SHARES GO? THE PRG OWNERSHIP TRAIL INVESTORS CANNOT IGNORE
Fair Value:RM 0.4477.3% undervalued
1 followerusers have followed this narrative
0 commentsusers have commented on this narrative
0 likesusers have liked this narrative
BR


Brunhilde_Wagner on Copart ·
Compounder to Cash Generator in Real Time
Fair Value:US$2710.3% overvalued
1 followerusers have followed this narrative
0 commentsusers have commented on this narrative
0 likesusers have liked this narrative
Popular Narratives
CU

CubanEros on Microsoft ·
A wonderful business at reasonable price.
Fair Value:US$419.917.3% undervalued
86 followersusers have followed this narrative
0 commentsusers have commented on this narrative
6 likesusers have liked this narrative
OS


oscargarcia on NVIDIA ·
The company that went from selling GPUs to gamers to becoming the AI arms dealer of the 21st century.
Fair Value:US$28029.8% undervalued
195 followersusers have followed this narrative
9 commentsusers have commented on this narrative
15 likesusers have liked this narrative
BE

benjamin_lvieq on PayPal Holdings ·
PayPal: PayPal Doesn't Need to Grow – It Needs to Stop Falling – A Mispriced Cash Machine With a Cannibal Buyback
Fair Value:US$6513.7% undervalued
72 followersusers have followed this narrative
2 commentsusers have commented on this narrative
11 likesusers have liked this narrative
Trending Discussion
DE

derek_3wsdg on Teladoc Health ·
You’ve overlooked the activist investor factor. Travis Cocke’s Voss has announced 5% ownership through a 13G filing. They’ve added to that 5% since, and in doing so, have created a structural trap door for 27.42 Million Shares actively sold short. Chuck will announce lots of positives on July 29 but it’s what Voss announces shortly after that will rock the overextended Teledoc shorts. The Walmart partnership is the tip of the iceberg. The market is missing the sheer regulatory and enterprise friction of modern corporate healthcare. Teladoc isn't a "consumer app"; it is the primary digital infrastructure integrated directly into the legacy backends of Tier-1 insurance companies and fortune 500 employers, covering 105 million+ lives. Teladoc is acting as the digital top-of-funnel engine for the world's largest retailer. If Voss pushes the narrative that Teladoc is effectively the outsourced digital brain of Walmart's entire healthcare footprint, the fair value shifts from a basic health multiple to an enterprise distribution premium. Additionally , we are in a structural gold rush for high-quality, legally compliant, longitudinal medical data to train vertical healthcare AI models. Large technology hyperscalers and pharmaceutical giants cannot simply scrape the internet for this; they need structured clinical inputs. Teladoc sits on one of the largest de-identified virtual medical datasets on earth. From the activist playbook , we’ll see Voss demand the immediate creation of a Data & Diagnostics Licensing Division, transforming a legacy liability into an incredibly high-margin, pure-software data asset that requires zero human clinician hours to scale. Chuck is doing great work and deserves credi5 for the Teledoc turnaround but it will be Travis Cocke who will be responsible for a share price way beyond your $15 valuation.
1
|0

