Are S A Tech Software India Limited's (NSE:SATECH) Fundamentals Good Enough to Warrant Buying Given The Stock's Recent Weakness?


With its stock down 48% over the past three months, it is easy to disregard S A Tech Software India (NSE:SATECH). But if you pay close attention, you might find that its key financial indicators look quite decent, which could mean that the stock could potentially rise in the long-term given how markets usually reward more resilient long-term fundamentals. Particularly, we will be paying attention to S A Tech Software India's ROE today.
ROE or return on equity is a useful tool to assess how effectively a company can generate returns on the investment it received from its shareholders. Put another way, it reveals the company's success at turning shareholder investments into profits.
View our latest analysis for S A Tech Software India
How Is ROE Calculated?
ROE can be calculated by using the formula:
Return on Equity = Net Profit (from continuing operations) ÷ Shareholders' Equity
So, based on the above formula, the ROE for S A Tech Software India is:
13% = ₹47m ÷ ₹367m (Based on the trailing twelve months to September 2024).
The 'return' is the yearly profit. So, this means that for every ₹1 of its shareholder's investments, the company generates a profit of ₹0.13.
Why Is ROE Important For Earnings Growth?
Thus far, we have learned that ROE measures how efficiently a company is generating its profits. Based on how much of its profits the company chooses to reinvest or "retain", we are then able to evaluate a company's future ability to generate profits. Assuming everything else remains unchanged, the higher the ROE and profit retention, the higher the growth rate of a company compared to companies that don't necessarily bear these characteristics.
S A Tech Software India's Earnings Growth And 13% ROE
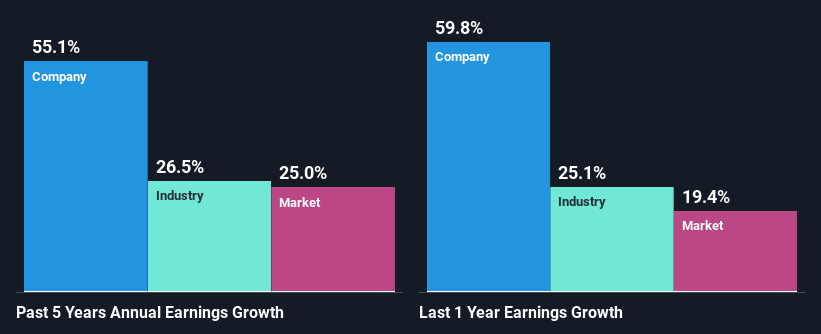
At first glance, S A Tech Software India's ROE doesn't look very promising. However, given that the company's ROE is similar to the average industry ROE of 15%, we may spare it some thought. Moreover, we are quite pleased to see that S A Tech Software India's net income grew significantly at a rate of 55% over the last five years. Taking into consideration that the ROE is not particularly high, we reckon that there could also be other factors at play which could be influencing the company's growth. Such as - high earnings retention or an efficient management in place.
We then compared S A Tech Software India's net income growth with the industry and we're pleased to see that the company's growth figure is higher when compared with the industry which has a growth rate of 26% in the same 5-year period.
Earnings growth is an important metric to consider when valuing a stock. What investors need to determine next is if the expected earnings growth, or the lack of it, is already built into the share price. By doing so, they will have an idea if the stock is headed into clear blue waters or if swampy waters await. If you're wondering about S A Tech Software India's's valuation, check out this gauge of its price-to-earnings ratio, as compared to its industry.
Is S A Tech Software India Efficiently Re-investing Its Profits?
Given that S A Tech Software India doesn't pay any regular dividends to its shareholders, we infer that the company has been reinvesting all of its profits to grow its business.
Conclusion
In total, it does look like S A Tech Software India has some positive aspects to its business. Even in spite of the low rate of return, the company has posted impressive earnings growth as a result of reinvesting heavily into its business. While we won't completely dismiss the company, what we would do, is try to ascertain how risky the business is to make a more informed decision around the company. To know the 2 risks we have identified for S A Tech Software India visit our risks dashboard for free.
If you're looking to trade S A Tech Software India, open an account with the lowest-cost platform trusted by professionals, Interactive Brokers.
With clients in over 200 countries and territories, and access to 160 markets, IBKR lets you trade stocks, options, futures, forex, bonds and funds from a single integrated account.
Enjoy no hidden fees, no account minimums, and FX conversion rates as low as 0.03%, far better than what most brokers offer.
Sponsored ContentNew: Manage All Your Stock Portfolios in One Place
We've created the ultimate portfolio companion for stock investors, and it's free.
• Connect an unlimited number of Portfolios and see your total in one currency
• Be alerted to new Warning Signs or Risks via email or mobile
• Track the Fair Value of your stocks
Have feedback on this article? Concerned about the content? Get in touch with us directly. Alternatively, email editorial-team (at) simplywallst.com.
This article by Simply Wall St is general in nature. We provide commentary based on historical data and analyst forecasts only using an unbiased methodology and our articles are not intended to be financial advice. It does not constitute a recommendation to buy or sell any stock, and does not take account of your objectives, or your financial situation. We aim to bring you long-term focused analysis driven by fundamental data. Note that our analysis may not factor in the latest price-sensitive company announcements or qualitative material. Simply Wall St has no position in any stocks mentioned.
About NSEI:SATECH
Proven track record with adequate balance sheet.
Similar Companies
Market Insights

Community Narratives
