Calculating The Intrinsic Value Of Intense Technologies Limited (NSE:INTENTECH)

Key Insights
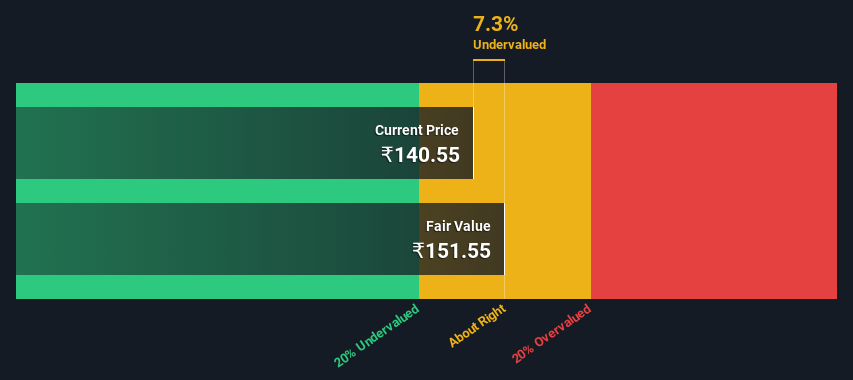
- Intense Technologies' estimated fair value is ₹152 based on 2 Stage Free Cash Flow to Equity
- Intense Technologies' ₹141 share price indicates it is trading at similar levels as its fair value estimate
- Peers of Intense Technologies are currently trading on average at a 285% premium
Today we will run through one way of estimating the intrinsic value of Intense Technologies Limited (NSE:INTENTECH) by projecting its future cash flows and then discounting them to today's value. We will take advantage of the Discounted Cash Flow (DCF) model for this purpose. Models like these may appear beyond the comprehension of a lay person, but they're fairly easy to follow.
Remember though, that there are many ways to estimate a company's value, and a DCF is just one method. Anyone interested in learning a bit more about intrinsic value should have a read of the Simply Wall St analysis model.
Check out our latest analysis for Intense Technologies
What's The Estimated Valuation?
We use what is known as a 2-stage model, which simply means we have two different periods of growth rates for the company's cash flows. Generally the first stage is higher growth, and the second stage is a lower growth phase. To start off with, we need to estimate the next ten years of cash flows. Seeing as no analyst estimates of free cash flow are available to us, we have extrapolate the previous free cash flow (FCF) from the company's last reported value. We assume companies with shrinking free cash flow will slow their rate of shrinkage, and that companies with growing free cash flow will see their growth rate slow, over this period. We do this to reflect that growth tends to slow more in the early years than it does in later years.
A DCF is all about the idea that a dollar in the future is less valuable than a dollar today, and so the sum of these future cash flows is then discounted to today's value:
10-year free cash flow (FCF) forecast
| 2025 | 2026 | 2027 | 2028 | 2029 | 2030 | 2031 | 2032 | 2033 | 2034 | |
| Levered FCF (₹, Millions) | ₹229.8m | ₹248.4m | ₹267.4m | ₹287.1m | ₹307.7m | ₹329.4m | ₹352.2m | ₹376.4m | ₹402.0m | ₹429.3m |
| Growth Rate Estimate Source | Est @ 8.68% | Est @ 8.09% | Est @ 7.67% | Est @ 7.38% | Est @ 7.18% | Est @ 7.03% | Est @ 6.93% | Est @ 6.86% | Est @ 6.81% | Est @ 6.78% |
| Present Value (₹, Millions) Discounted @ 13% | ₹203 | ₹193 | ₹183 | ₹173 | ₹164 | ₹155 | ₹146 | ₹137 | ₹129 | ₹122 |
("Est" = FCF growth rate estimated by Simply Wall St)
Present Value of 10-year Cash Flow (PVCF) = ₹1.6b
We now need to calculate the Terminal Value, which accounts for all the future cash flows after this ten year period. For a number of reasons a very conservative growth rate is used that cannot exceed that of a country's GDP growth. In this case we have used the 5-year average of the 10-year government bond yield (6.7%) to estimate future growth. In the same way as with the 10-year 'growth' period, we discount future cash flows to today's value, using a cost of equity of 13%.
Terminal Value (TV)= FCF2034 × (1 + g) ÷ (r – g) = ₹429m× (1 + 6.7%) ÷ (13%– 6.7%) = ₹6.8b
Present Value of Terminal Value (PVTV)= TV / (1 + r)10= ₹6.8b÷ ( 1 + 13%)10= ₹1.9b
The total value, or equity value, is then the sum of the present value of the future cash flows, which in this case is ₹3.5b. In the final step we divide the equity value by the number of shares outstanding. Relative to the current share price of ₹141, the company appears about fair value at a 7.3% discount to where the stock price trades currently. Valuations are imprecise instruments though, rather like a telescope - move a few degrees and end up in a different galaxy. Do keep this in mind.
The Assumptions
We would point out that the most important inputs to a discounted cash flow are the discount rate and of course the actual cash flows. Part of investing is coming up with your own evaluation of a company's future performance, so try the calculation yourself and check your own assumptions. The DCF also does not consider the possible cyclicality of an industry, or a company's future capital requirements, so it does not give a full picture of a company's potential performance. Given that we are looking at Intense Technologies as potential shareholders, the cost of equity is used as the discount rate, rather than the cost of capital (or weighted average cost of capital, WACC) which accounts for debt. In this calculation we've used 13%, which is based on a levered beta of 0.989. Beta is a measure of a stock's volatility, compared to the market as a whole. We get our beta from the industry average beta of globally comparable companies, with an imposed limit between 0.8 and 2.0, which is a reasonable range for a stable business.
SWOT Analysis for Intense Technologies
- Earnings growth over the past year exceeded its 5-year average.
- Debt is not viewed as a risk.
- Dividends are covered by earnings and cash flows.
- Earnings growth over the past year underperformed the Software industry.
- Dividend is low compared to the top 25% of dividend payers in the Software market.
- Current share price is below our estimate of fair value.
- Lack of analyst coverage makes it difficult to determine INTENTECH's earnings prospects.
- No apparent threats visible for INTENTECH.
Looking Ahead:
Valuation is only one side of the coin in terms of building your investment thesis, and it is only one of many factors that you need to assess for a company. The DCF model is not a perfect stock valuation tool. Instead the best use for a DCF model is to test certain assumptions and theories to see if they would lead to the company being undervalued or overvalued. For instance, if the terminal value growth rate is adjusted slightly, it can dramatically alter the overall result. For Intense Technologies, we've compiled three further factors you should look at:
- Risks: Case in point, we've spotted 3 warning signs for Intense Technologies you should be aware of, and 1 of them is significant.
- Other High Quality Alternatives: Do you like a good all-rounder? Explore our interactive list of high quality stocks to get an idea of what else is out there you may be missing!
- Other Environmentally-Friendly Companies: Concerned about the environment and think consumers will buy eco-friendly products more and more? Browse through our interactive list of companies that are thinking about a greener future to discover some stocks you may not have thought of!
PS. The Simply Wall St app conducts a discounted cash flow valuation for every stock on the NSEI every day. If you want to find the calculation for other stocks just search here.
Mobile Infrastructure for Defense and Disaster
The next wave in robotics isn't humanoid. Its fully autonomous towers delivering 5G, ISR, and radar in under 30 minutes, anywhere.
Get the investor briefing before the next round of contracts
Sponsored On Behalf of CiTechNew: AI Stock Screener & Alerts
Our new AI Stock Screener scans the market every day to uncover opportunities.
• Dividend Powerhouses (3%+ Yield)
• Undervalued Small Caps with Insider Buying
• High growth Tech and AI Companies
Or build your own from over 50 metrics.
Have feedback on this article? Concerned about the content? Get in touch with us directly. Alternatively, email editorial-team (at) simplywallst.com.
This article by Simply Wall St is general in nature. We provide commentary based on historical data and analyst forecasts only using an unbiased methodology and our articles are not intended to be financial advice. It does not constitute a recommendation to buy or sell any stock, and does not take account of your objectives, or your financial situation. We aim to bring you long-term focused analysis driven by fundamental data. Note that our analysis may not factor in the latest price-sensitive company announcements or qualitative material. Simply Wall St has no position in any stocks mentioned.
Have feedback on this article? Concerned about the content? Get in touch with us directly. Alternatively, email editorial-team@simplywallst.com
About NSEI:INTENTECH
Intense Technologies
Provides enterprise platform and IP-enabled service organization services in India.
Flawless balance sheet with moderate risk.
Market Insights

Weekly Picks

THE KINGDOM OF BROWN GOODS: WHY MGPI IS BEING CRUSHED BY INVENTORY & PRIMED FOR RESURRECTION


Why Vertical Aerospace (NYSE: EVTL) is Worth Possibly Over 13x its Current Price


The Quiet Giant That Became AI’s Power Grid
Recently Updated Narratives

Deep Value Multi Bagger Opportunity


A case for CA$31.80 (undiluted), aka 8,616% upside from CA$0.37 (an 86 bagger!).


Unicycive Therapeutics (Nasdaq: UNCY) – Preparing for a Second Shot at Bringing a New Kidney Treatment to Market (TEST)
Popular Narratives


MicroVision will explode future revenue by 380.37% with a vision towards success


NVDA: Expanding AI Demand Will Drive Major Data Center Investments Through 2026


Crazy Undervalued 42 Baggers Silver Play (Active & Running Mine)
Trending Discussion

