

Legendary fund manager Li Lu (who Charlie Munger backed) once said, 'The biggest investment risk is not the volatility of prices, but whether you will suffer a permanent loss of capital.' It's only natural to consider a company's balance sheet when you examine how risky it is, since debt is often involved when a business collapses. We can see that Trent Limited (NSE:TRENT) does use debt in its business. But is this debt a concern to shareholders?
Why Does Debt Bring Risk?
Generally speaking, debt only becomes a real problem when a company can't easily pay it off, either by raising capital or with its own cash flow. Part and parcel of capitalism is the process of 'creative destruction' where failed businesses are mercilessly liquidated by their bankers. However, a more common (but still painful) scenario is that it has to raise new equity capital at a low price, thus permanently diluting shareholders. Having said that, the most common situation is where a company manages its debt reasonably well - and to its own advantage. When we think about a company's use of debt, we first look at cash and debt together.
Check out our latest analysis for Trent
How Much Debt Does Trent Carry?
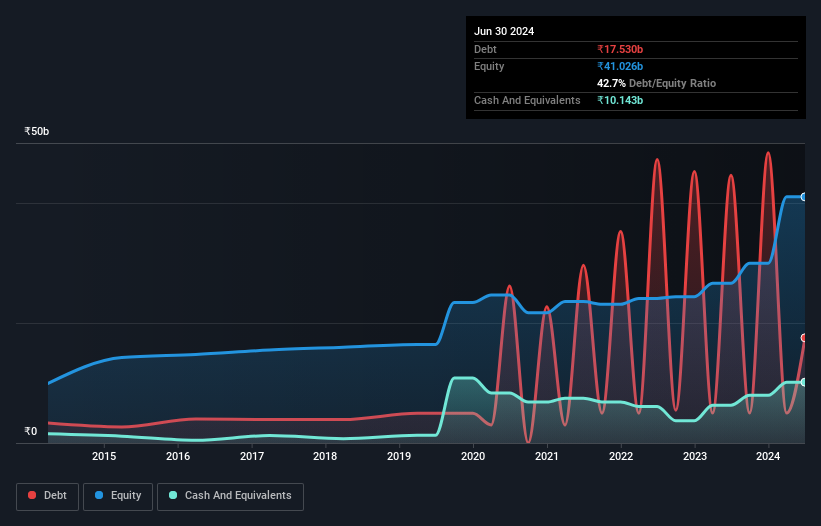
You can click the graphic below for the historical numbers, but it shows that Trent had ₹17.5b of debt in March 2024, down from ₹44.6b, one year before. However, it also had ₹10.1b in cash, and so its net debt is ₹7.39b.
A Look At Trent's Liabilities
According to the last reported balance sheet, Trent had liabilities of ₹15.4b due within 12 months, and liabilities of ₹15.2b due beyond 12 months. Offsetting this, it had ₹10.1b in cash and ₹3.02b in receivables that were due within 12 months. So it has liabilities totalling ₹17.4b more than its cash and near-term receivables, combined.
This state of affairs indicates that Trent's balance sheet looks quite solid, as its total liabilities are just about equal to its liquid assets. So while it's hard to imagine that the ₹2.66t company is struggling for cash, we still think it's worth monitoring its balance sheet. But either way, Trent has virtually no net debt, so it's fair to say it does not have a heavy debt load!
In order to size up a company's debt relative to its earnings, we calculate its net debt divided by its earnings before interest, tax, depreciation, and amortization (EBITDA) and its earnings before interest and tax (EBIT) divided by its interest expense (its interest cover). The advantage of this approach is that we take into account both the absolute quantum of debt (with net debt to EBITDA) and the actual interest expenses associated with that debt (with its interest cover ratio).
While Trent's low debt to EBITDA ratio of 0.43 suggests only modest use of debt, the fact that EBIT only covered the interest expense by 6.1 times last year does give us pause. But the interest payments are certainly sufficient to have us thinking about how affordable its debt is. Better yet, Trent grew its EBIT by 127% last year, which is an impressive improvement. If maintained that growth will make the debt even more manageable in the years ahead. When analysing debt levels, the balance sheet is the obvious place to start. But ultimately the future profitability of the business will decide if Trent can strengthen its balance sheet over time. So if you're focused on the future you can check out this free report showing analyst profit forecasts.
Finally, while the tax-man may adore accounting profits, lenders only accept cold hard cash. So the logical step is to look at the proportion of that EBIT that is matched by actual free cash flow. Looking at the most recent three years, Trent recorded free cash flow of 28% of its EBIT, which is weaker than we'd expect. That weak cash conversion makes it more difficult to handle indebtedness.
Our View
Happily, Trent's impressive EBIT growth rate implies it has the upper hand on its debt. But truth be told we feel its conversion of EBIT to free cash flow does undermine this impression a bit. Taking all this data into account, it seems to us that Trent takes a pretty sensible approach to debt. While that brings some risk, it can also enhance returns for shareholders. When analysing debt levels, the balance sheet is the obvious place to start. However, not all investment risk resides within the balance sheet - far from it. Be aware that Trent is showing 1 warning sign in our investment analysis , you should know about...
At the end of the day, it's often better to focus on companies that are free from net debt. You can access our special list of such companies (all with a track record of profit growth). It's free.
Valuation is complex, but we're here to simplify it.
Discover if Trent might be undervalued or overvalued with our detailed analysis, featuring fair value estimates, potential risks, dividends, insider trades, and its financial condition.
Access Free AnalysisHave feedback on this article? Concerned about the content? Get in touch with us directly. Alternatively, email editorial-team (at) simplywallst.com.
This article by Simply Wall St is general in nature. We provide commentary based on historical data and analyst forecasts only using an unbiased methodology and our articles are not intended to be financial advice. It does not constitute a recommendation to buy or sell any stock, and does not take account of your objectives, or your financial situation. We aim to bring you long-term focused analysis driven by fundamental data. Note that our analysis may not factor in the latest price-sensitive company announcements or qualitative material. Simply Wall St has no position in any stocks mentioned.
About NSEI:TRENT
Trent
Engages in the retailing and trading of apparels, footwear, accessories, toys, games, and other products in India.
Exceptional growth potential with flawless balance sheet.
Similar Companies
Market Insights

Community Narratives

