- India
- /
- Real Estate
- /
- NSEI:OBEROIRLTY
We Think Oberoi Realty (NSE:OBEROIRLTY) Can Stay On Top Of Its Debt


Legendary fund manager Li Lu (who Charlie Munger backed) once said, 'The biggest investment risk is not the volatility of prices, but whether you will suffer a permanent loss of capital.' It's only natural to consider a company's balance sheet when you examine how risky it is, since debt is often involved when a business collapses. We can see that Oberoi Realty Limited (NSE:OBEROIRLTY) does use debt in its business. But the more important question is: how much risk is that debt creating?
Why Does Debt Bring Risk?
Debt assists a business until the business has trouble paying it off, either with new capital or with free cash flow. Ultimately, if the company can't fulfill its legal obligations to repay debt, shareholders could walk away with nothing. While that is not too common, we often do see indebted companies permanently diluting shareholders because lenders force them to raise capital at a distressed price. Of course, plenty of companies use debt to fund growth, without any negative consequences. The first step when considering a company's debt levels is to consider its cash and debt together.
See our latest analysis for Oberoi Realty
What Is Oberoi Realty's Net Debt?
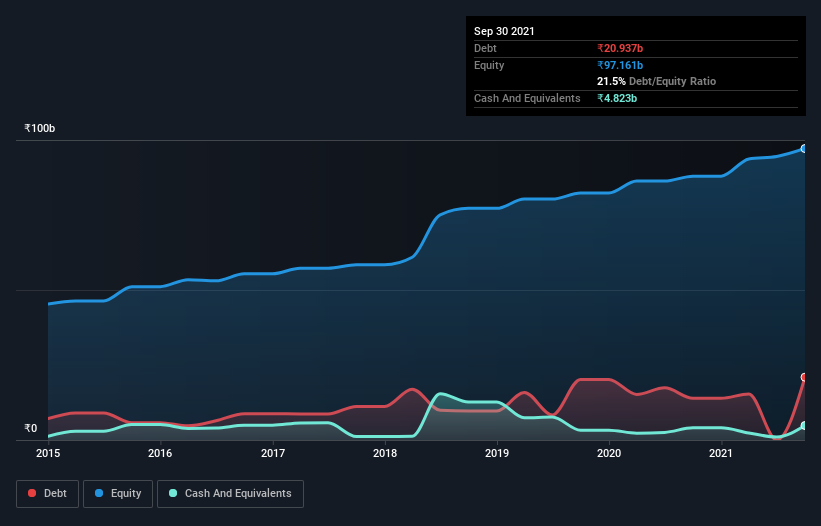
As you can see below, at the end of September 2021, Oberoi Realty had ₹20.9b of debt, up from ₹13.9b a year ago. Click the image for more detail. On the flip side, it has ₹4.82b in cash leading to net debt of about ₹16.1b.
A Look At Oberoi Realty's Liabilities
According to the last reported balance sheet, Oberoi Realty had liabilities of ₹25.0b due within 12 months, and liabilities of ₹12.9b due beyond 12 months. Offsetting these obligations, it had cash of ₹4.82b as well as receivables valued at ₹5.52b due within 12 months. So it has liabilities totalling ₹27.6b more than its cash and near-term receivables, combined.
Since publicly traded Oberoi Realty shares are worth a total of ₹304.2b, it seems unlikely that this level of liabilities would be a major threat. Having said that, it's clear that we should continue to monitor its balance sheet, lest it change for the worse.
We use two main ratios to inform us about debt levels relative to earnings. The first is net debt divided by earnings before interest, tax, depreciation, and amortization (EBITDA), while the second is how many times its earnings before interest and tax (EBIT) covers its interest expense (or its interest cover, for short). This way, we consider both the absolute quantum of the debt, as well as the interest rates paid on it.
Oberoi Realty's net debt is only 1.3 times its EBITDA. And its EBIT covers its interest expense a whopping 30.0 times over. So you could argue it is no more threatened by its debt than an elephant is by a mouse. In addition to that, we're happy to report that Oberoi Realty has boosted its EBIT by 51%, thus reducing the spectre of future debt repayments. There's no doubt that we learn most about debt from the balance sheet. But it is future earnings, more than anything, that will determine Oberoi Realty's ability to maintain a healthy balance sheet going forward. So if you want to see what the professionals think, you might find this free report on analyst profit forecasts to be interesting.
Finally, a company can only pay off debt with cold hard cash, not accounting profits. So the logical step is to look at the proportion of that EBIT that is matched by actual free cash flow. Over the last three years, Oberoi Realty saw substantial negative free cash flow, in total. While that may be a result of expenditure for growth, it does make the debt far more risky.
Our View
Happily, Oberoi Realty's impressive interest cover implies it has the upper hand on its debt. But we must concede we find its conversion of EBIT to free cash flow has the opposite effect. Looking at all the aforementioned factors together, it strikes us that Oberoi Realty can handle its debt fairly comfortably. On the plus side, this leverage can boost shareholder returns, but the potential downside is more risk of loss, so it's worth monitoring the balance sheet. Above most other metrics, we think its important to track how fast earnings per share is growing, if at all. If you've also come to that realization, you're in luck, because today you can view this interactive graph of Oberoi Realty's earnings per share history for free.
When all is said and done, sometimes its easier to focus on companies that don't even need debt. Readers can access a list of growth stocks with zero net debt 100% free, right now.
If you're looking to trade Oberoi Realty, open an account with the lowest-cost platform trusted by professionals, Interactive Brokers.
With clients in over 200 countries and territories, and access to 160 markets, IBKR lets you trade stocks, options, futures, forex, bonds and funds from a single integrated account.
Enjoy no hidden fees, no account minimums, and FX conversion rates as low as 0.03%, far better than what most brokers offer.
Sponsored ContentNew: AI Stock Screener & Alerts
Our new AI Stock Screener scans the market every day to uncover opportunities.
• Dividend Powerhouses (3%+ Yield)
• Undervalued Small Caps with Insider Buying
• High growth Tech and AI Companies
Or build your own from over 50 metrics.
Have feedback on this article? Concerned about the content? Get in touch with us directly. Alternatively, email editorial-team (at) simplywallst.com.
This article by Simply Wall St is general in nature. We provide commentary based on historical data and analyst forecasts only using an unbiased methodology and our articles are not intended to be financial advice. It does not constitute a recommendation to buy or sell any stock, and does not take account of your objectives, or your financial situation. We aim to bring you long-term focused analysis driven by fundamental data. Note that our analysis may not factor in the latest price-sensitive company announcements or qualitative material. Simply Wall St has no position in any stocks mentioned.
About NSEI:OBEROIRLTY
Oberoi Realty
Engages in real estate development and hospitality businesses in India.
Excellent balance sheet with reasonable growth potential and pays a dividend.
Similar Companies
Market Insights

Community Narratives


