

Howard Marks put it nicely when he said that, rather than worrying about share price volatility, 'The possibility of permanent loss is the risk I worry about... and every practical investor I know worries about.' So it might be obvious that you need to consider debt, when you think about how risky any given stock is, because too much debt can sink a company. We note that Oberoi Realty Limited (NSE:OBEROIRLTY) does have debt on its balance sheet. But is this debt a concern to shareholders?
When Is Debt A Problem?
Generally speaking, debt only becomes a real problem when a company can't easily pay it off, either by raising capital or with its own cash flow. Part and parcel of capitalism is the process of 'creative destruction' where failed businesses are mercilessly liquidated by their bankers. However, a more common (but still painful) scenario is that it has to raise new equity capital at a low price, thus permanently diluting shareholders. Having said that, the most common situation is where a company manages its debt reasonably well - and to its own advantage. The first step when considering a company's debt levels is to consider its cash and debt together.
View our latest analysis for Oberoi Realty
What Is Oberoi Realty's Debt?
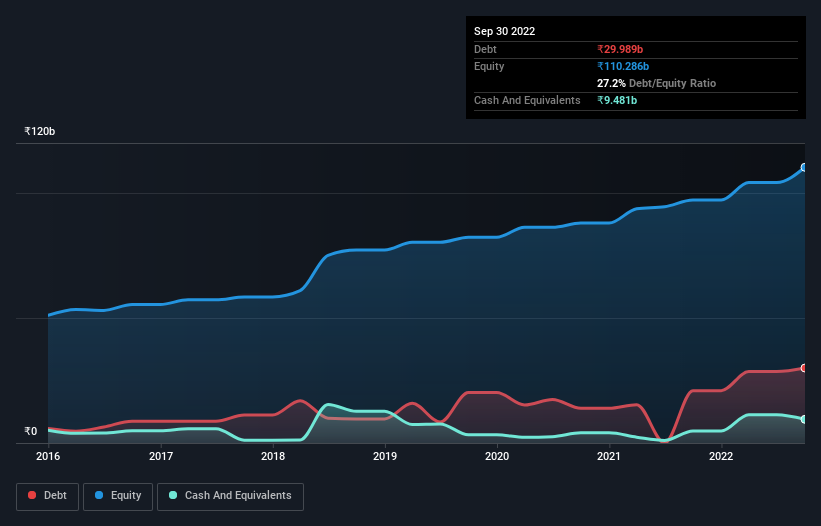
You can click the graphic below for the historical numbers, but it shows that as of September 2022 Oberoi Realty had ₹30.0b of debt, an increase on ₹20.9b, over one year. However, it does have ₹9.48b in cash offsetting this, leading to net debt of about ₹20.5b.
A Look At Oberoi Realty's Liabilities
Zooming in on the latest balance sheet data, we can see that Oberoi Realty had liabilities of ₹28.7b due within 12 months and liabilities of ₹26.0b due beyond that. Offsetting this, it had ₹9.48b in cash and ₹6.42b in receivables that were due within 12 months. So its liabilities outweigh the sum of its cash and (near-term) receivables by ₹38.9b.
Since publicly traded Oberoi Realty shares are worth a total of ₹337.0b, it seems unlikely that this level of liabilities would be a major threat. However, we do think it is worth keeping an eye on its balance sheet strength, as it may change over time.
We measure a company's debt load relative to its earnings power by looking at its net debt divided by its earnings before interest, tax, depreciation, and amortization (EBITDA) and by calculating how easily its earnings before interest and tax (EBIT) cover its interest expense (interest cover). The advantage of this approach is that we take into account both the absolute quantum of debt (with net debt to EBITDA) and the actual interest expenses associated with that debt (with its interest cover ratio).
Oberoi Realty has a low net debt to EBITDA ratio of only 1.4. And its EBIT covers its interest expense a whopping 17.6 times over. So you could argue it is no more threatened by its debt than an elephant is by a mouse. And we also note warmly that Oberoi Realty grew its EBIT by 19% last year, making its debt load easier to handle. When analysing debt levels, the balance sheet is the obvious place to start. But it is future earnings, more than anything, that will determine Oberoi Realty's ability to maintain a healthy balance sheet going forward. So if you're focused on the future you can check out this free report showing analyst profit forecasts.
Finally, while the tax-man may adore accounting profits, lenders only accept cold hard cash. So we clearly need to look at whether that EBIT is leading to corresponding free cash flow. Over the last three years, Oberoi Realty saw substantial negative free cash flow, in total. While that may be a result of expenditure for growth, it does make the debt far more risky.
Our View
Based on what we've seen Oberoi Realty is not finding it easy, given its conversion of EBIT to free cash flow, but the other factors we considered give us cause to be optimistic. There's no doubt that its ability to to cover its interest expense with its EBIT is pretty flash. Considering this range of data points, we think Oberoi Realty is in a good position to manage its debt levels. Having said that, the load is sufficiently heavy that we would recommend any shareholders keep a close eye on it. Above most other metrics, we think its important to track how fast earnings per share is growing, if at all. If you've also come to that realization, you're in luck, because today you can view this interactive graph of Oberoi Realty's earnings per share history for free.
Of course, if you're the type of investor who prefers buying stocks without the burden of debt, then don't hesitate to discover our exclusive list of net cash growth stocks, today.
If you're looking to trade Oberoi Realty, open an account with the lowest-cost platform trusted by professionals, Interactive Brokers.
With clients in over 200 countries and territories, and access to 160 markets, IBKR lets you trade stocks, options, futures, forex, bonds and funds from a single integrated account.
Enjoy no hidden fees, no account minimums, and FX conversion rates as low as 0.03%, far better than what most brokers offer.
Sponsored ContentNew: AI Stock Screener & Alerts
Our new AI Stock Screener scans the market every day to uncover opportunities.
• Dividend Powerhouses (3%+ Yield)
• Undervalued Small Caps with Insider Buying
• High growth Tech and AI Companies
Or build your own from over 50 metrics.
Have feedback on this article? Concerned about the content? Get in touch with us directly. Alternatively, email editorial-team (at) simplywallst.com.
This article by Simply Wall St is general in nature. We provide commentary based on historical data and analyst forecasts only using an unbiased methodology and our articles are not intended to be financial advice. It does not constitute a recommendation to buy or sell any stock, and does not take account of your objectives, or your financial situation. We aim to bring you long-term focused analysis driven by fundamental data. Note that our analysis may not factor in the latest price-sensitive company announcements or qualitative material. Simply Wall St has no position in any stocks mentioned.
About NSEI:OBEROIRLTY
Oberoi Realty
Engages in real estate development and hospitality businesses in India.
Excellent balance sheet with reasonable growth potential and pays a dividend.
Similar Companies
Market Insights

Community Narratives


