- India
- /
- Real Estate
- /
- NSEI:ANSALAPI
Ansal Properties & Infrastructure Limited's (NSE:ANSALAPI) Shares Bounce 26% But Its Business Still Trails The Industry

Ansal Properties & Infrastructure Limited (NSE:ANSALAPI) shareholders have had their patience rewarded with a 26% share price jump in the last month. Not all shareholders will be feeling jubilant, since the share price is still down a very disappointing 48% in the last twelve months.
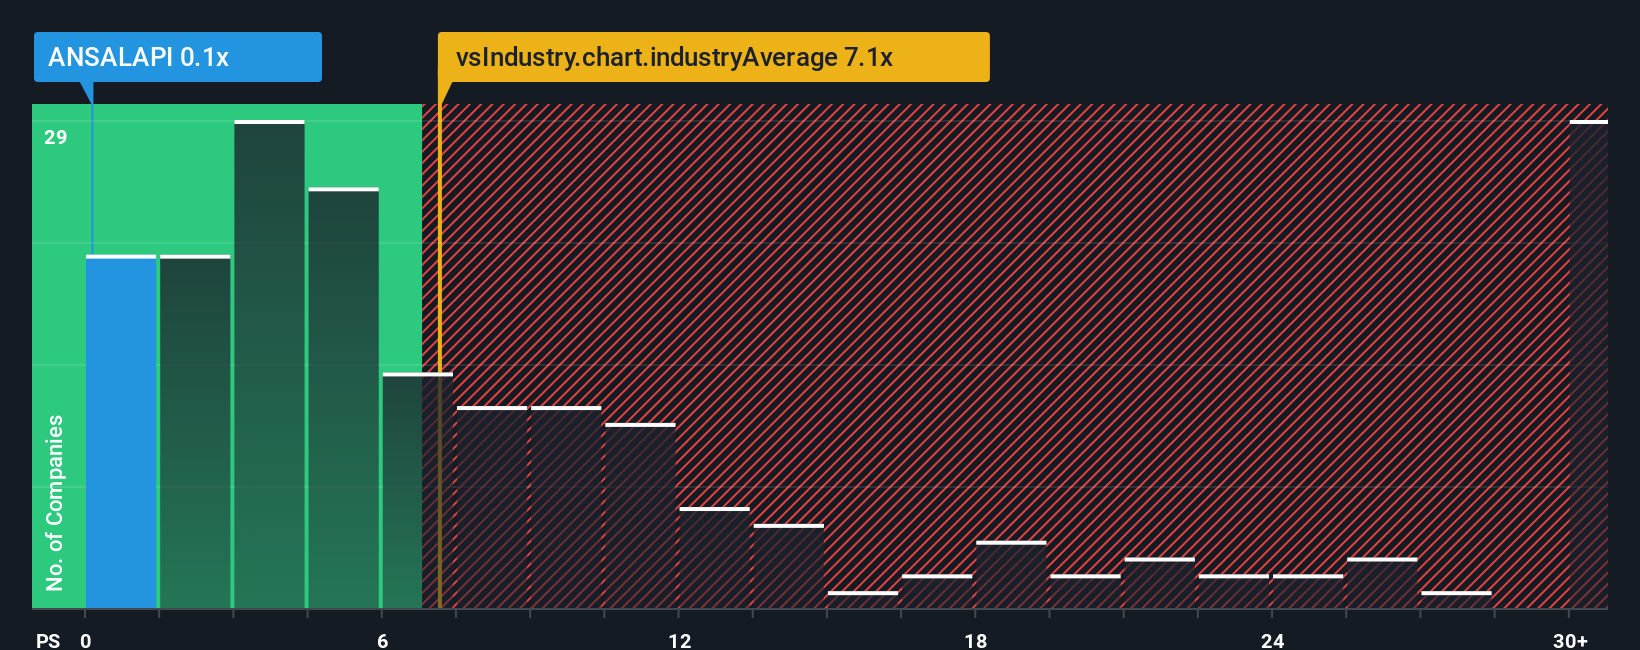
Even after such a large jump in price, Ansal Properties & Infrastructure may still look like a strong buying opportunity at present with its price-to-sales (or "P/S") ratio of 0.1x, considering almost half of all companies in the Real Estate industry in India have P/S ratios greater than 7.1x and even P/S higher than 16x aren't out of the ordinary. However, the P/S might be quite low for a reason and it requires further investigation to determine if it's justified.
See our latest analysis for Ansal Properties & Infrastructure
What Does Ansal Properties & Infrastructure's Recent Performance Look Like?
The revenue growth achieved at Ansal Properties & Infrastructure over the last year would be more than acceptable for most companies. One possibility is that the P/S is low because investors think this respectable revenue growth might actually underperform the broader industry in the near future. Those who are bullish on Ansal Properties & Infrastructure will be hoping that this isn't the case, so that they can pick up the stock at a lower valuation.
Although there are no analyst estimates available for Ansal Properties & Infrastructure, take a look at this free data-rich visualisation to see how the company stacks up on earnings, revenue and cash flow.How Is Ansal Properties & Infrastructure's Revenue Growth Trending?
The only time you'd be truly comfortable seeing a P/S as depressed as Ansal Properties & Infrastructure's is when the company's growth is on track to lag the industry decidedly.
If we review the last year of revenue growth, the company posted a worthy increase of 9.0%. The latest three year period has also seen a 6.7% overall rise in revenue, aided somewhat by its short-term performance. Accordingly, shareholders would have probably been satisfied with the medium-term rates of revenue growth.
This is in contrast to the rest of the industry, which is expected to grow by 46% over the next year, materially higher than the company's recent medium-term annualised growth rates.
With this information, we can see why Ansal Properties & Infrastructure is trading at a P/S lower than the industry. It seems most investors are expecting to see the recent limited growth rates continue into the future and are only willing to pay a reduced amount for the stock.
The Key Takeaway
Shares in Ansal Properties & Infrastructure have risen appreciably however, its P/S is still subdued. It's argued the price-to-sales ratio is an inferior measure of value within certain industries, but it can be a powerful business sentiment indicator.
Our examination of Ansal Properties & Infrastructure confirms that the company's revenue trends over the past three-year years are a key factor in its low price-to-sales ratio, as we suspected, given they fall short of current industry expectations. At this stage investors feel the potential for an improvement in revenue isn't great enough to justify a higher P/S ratio. Unless the recent medium-term conditions improve, they will continue to form a barrier for the share price around these levels.
Before you take the next step, you should know about the 3 warning signs for Ansal Properties & Infrastructure that we have uncovered.
Of course, profitable companies with a history of great earnings growth are generally safer bets. So you may wish to see this free collection of other companies that have reasonable P/E ratios and have grown earnings strongly.
The New Payments ETF Is Live on NASDAQ:
Money is moving to real-time rails, and a newly listed ETF now gives investors direct exposure. Fast settlement. Institutional custody. Simple access.
Explore how this launch could reshape portfolios
Sponsored ContentNew: Manage All Your Stock Portfolios in One Place
We've created the ultimate portfolio companion for stock investors, and it's free.
• Connect an unlimited number of Portfolios and see your total in one currency
• Be alerted to new Warning Signs or Risks via email or mobile
• Track the Fair Value of your stocks
Have feedback on this article? Concerned about the content? Get in touch with us directly. Alternatively, email editorial-team (at) simplywallst.com.
This article by Simply Wall St is general in nature. We provide commentary based on historical data and analyst forecasts only using an unbiased methodology and our articles are not intended to be financial advice. It does not constitute a recommendation to buy or sell any stock, and does not take account of your objectives, or your financial situation. We aim to bring you long-term focused analysis driven by fundamental data. Note that our analysis may not factor in the latest price-sensitive company announcements or qualitative material. Simply Wall St has no position in any stocks mentioned.
About NSEI:ANSALAPI
Ansal Properties & Infrastructure
Engages in the real estate development business in India.
Good value with slight risk.
Similar Companies
Market Insights

Weekly Picks

THE KINGDOM OF BROWN GOODS: WHY MGPI IS BEING CRUSHED BY INVENTORY & PRIMED FOR RESURRECTION


Why Vertical Aerospace (NYSE: EVTL) is Worth Possibly Over 13x its Current Price


The Quiet Giant That Became AI’s Power Grid
Recently Updated Narratives

Agfa-Gevaert is a digital and materials turnaround opportunity, with growth potential in ZIRFON, but carrying legacy risks.

Hitit Bilgisayar Hizmetleri will achieve a 19.7% revenue boost in the next five years


MINISO's fair value is projected at 26.69 with an anticipated PE ratio shift of 20x
Popular Narratives


MicroVision will explode future revenue by 380.37% with a vision towards success


Crazy Undervalued 42 Baggers Silver Play (Active & Running Mine)


